Published: 5 September 2019
Accrual of environmental taxes remained unchanged in 2017
The accrual of environmental taxes in 2017 remained on level with the year before, at EUR 6.7 billion. Households' share of all paid environmental taxes was 51 per cent. Compared to the year before, the taxes paid by households increased by two per cent. The share of environmental taxes in Finland’s total tax revenue decreased slightly to 6.9 per cent, however still being slightly above the average for EU countries
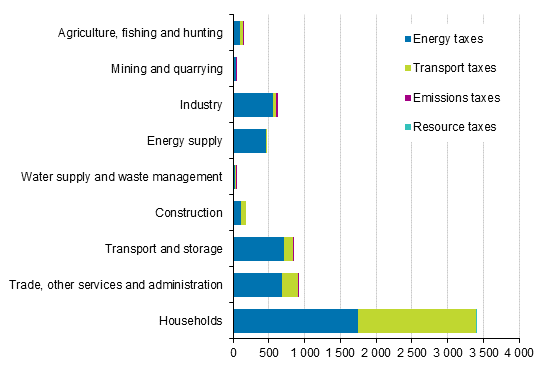
Environmental taxes by industry and tax type in 2017, EUR million

Energy taxes declined by two per cent from the previous year, to EUR 4.4 billion. However, the accrual of energy taxes declined despite the taxes for transport and heating fuels being raised at the beginning of 2017. For transport fuels, the drop is explained by lower use of petrol and switching to biofuels that have a lower level of taxation. Taxes paid by households decreased by three per cent and represented 39 per cent of all energy taxes. Taxes paid by energy supply fell by six per cent.
Transport taxes grew by six per cent cent from last year to EUR 2.2 billion. The biggest change was seen in transport taxes paid by households, which grew by eight per cent. The growth was mainly caused by an increase in the basic tax of the vehicle tax at the beginning of 2017 Households’ share of all transport taxes was 75 per cent in 2017.
Emission taxes fell by 20 per cent from 2016 and amounted to EUR 39.8 million. The tax revenue decreased particularly in water supply, sewerage and waste management, where paid emission taxes declined by 43 per cent. The change is caused by a long downward trend in the landfill disposal of municipal waste. This has been replaced with incineration of waste, on which no waste tax is paid.
Environmental taxes by industry and tax type in 2017, EUR million
| Industries | Energy taxes | Transport taxes | Emissions taxes | Resource taxes | Environmental taxes total |
| Agriculture, fishing and hunting | 67.1 | 38.0 | 0.0 | . 1) | 105.1 |
| Forestry | 28.7 | 5.6 | 0.4 | . | 34.7 |
| Mining and quarrying | 38.7 | 8.1 | 0.1 | . | 46.9 |
| Food industry | 26.2 | 7.7 | 16.0 | . | 49.9 |
| Forest industry | 92.4 | 5.1 | 0.3 | . | 97.8 |
| Oil refining and manufacture of chemicals | 321.6 | 6.7 | 8.6 | . | 336.9 |
| Manufacture of basic metals and metal products | 59.4 | 7.4 | 0.0 | . | 66.8 |
| Other manufacturing | 60.1 | 19.7 | 0.4 | . | 80.2 |
| Energy supply | 461.5 | 18.2 | . | . | 479.7 |
| Water supply and waste management | 31.5 | 7.3 | 12.0 | . | 50.8 |
| Construction | 111.2 | 74.1 | 0.0 | . | 185.3 |
| Trade | 100.9 | 68.8 | 0.2 | . | 169.9 |
| Land transport and transport via pipelines | 493.4 | 105.7 | 0.6 | . | 599.7 |
| Water transport | 87.4 | 0.2 | 0.0 | . | 87.6 |
| Air transport | 51.0 | 0.4 | . | . | 51.4 |
| Support activities for transportation, post | 83.7 | 21.7 | 0.3 | . | 105.7 |
| Real estate activities | 184.1 | 14.2 | . | . | 198.3 |
| Other service activities and administration | 394.8 | 140.6 | 0.4 | . | 535.8 |
| Households | 1 742.7 | 1 645.5 | 0.5 | 22.0 | 3 410.7 |
| TOTAL | 4 436.4 | 2 195.0 | 39.8 | 22.0 | 6 693.2 |
Environmental taxes are comprised of energy taxes, transport taxes, emission taxes and resource taxes. The majority of environmental taxes are energy taxes on electricity and fuels. One-third of environmental taxes are different types of transport taxes collected on vehicles, including, for example, the vehicle tax and the motor vehicle tax. The majority of emission taxes is waste tax. Taxes paid on carbon dioxide emissions are included in energy taxes. Licence fees for hunting and fishing are resource taxes in Finland
Source: Environmental taxes 2017, by industry, Statistics Finland
Inquiries: Juuso Peltola 029 551 2330, ymparistotilinpito@stat.fi
Director in charge: Ville Vertanen
Publication in pdf-format (257.5 kB)
- Tables
-
Tables in databases
Pick the data you need into tables, view the data as graphs, or download the data for your use.
Appendix tables
- Appendix table 1. Total environmental taxes by industry 2011-2017, EUR million (5.9.2019)
- Appendix table 2. Energy taxes by industry 2011-2017, EUR million (5.9.2019)
- Appendix table 3. Transport taxes by industry 2011-2017, EUR million (5.9.2019)
- Appendix table 4. Emission taxes by industry 2011-2017, EUR million (5.9.2019)
- Appendix table 5. Resource taxes by industry 2011-2017, EUR million (5.9.2019)
Updated 5.9.2019
Official Statistics of Finland (OSF):
Environmental and energy taxes [e-publication].
ISSN=2341-796X. 2017. Helsinki: Statistics Finland [referred: 8.2.2026].
Access method: http://stat.fi/til/yev/2017/yev_2017_2019-09-05_tie_001_en.html

