Change
New database table replacing the old table has been published in the statistics 17.6.2026.
Read more about the changeCulture satellite accounts 2024
According to Statistics Finland, value added and employment in the field of culture decreased slightly in 2024. However, the share of culture in the value added of the whole national economy remained almost unchanged. At the same time, households' expenditure used on culture grew measured in euros, as a result of which the share of cultural expenditure of all consumption expenditure grew slightly.
New database table replacing the old table has been published in the statistics 17.6.2026.
Read more about the change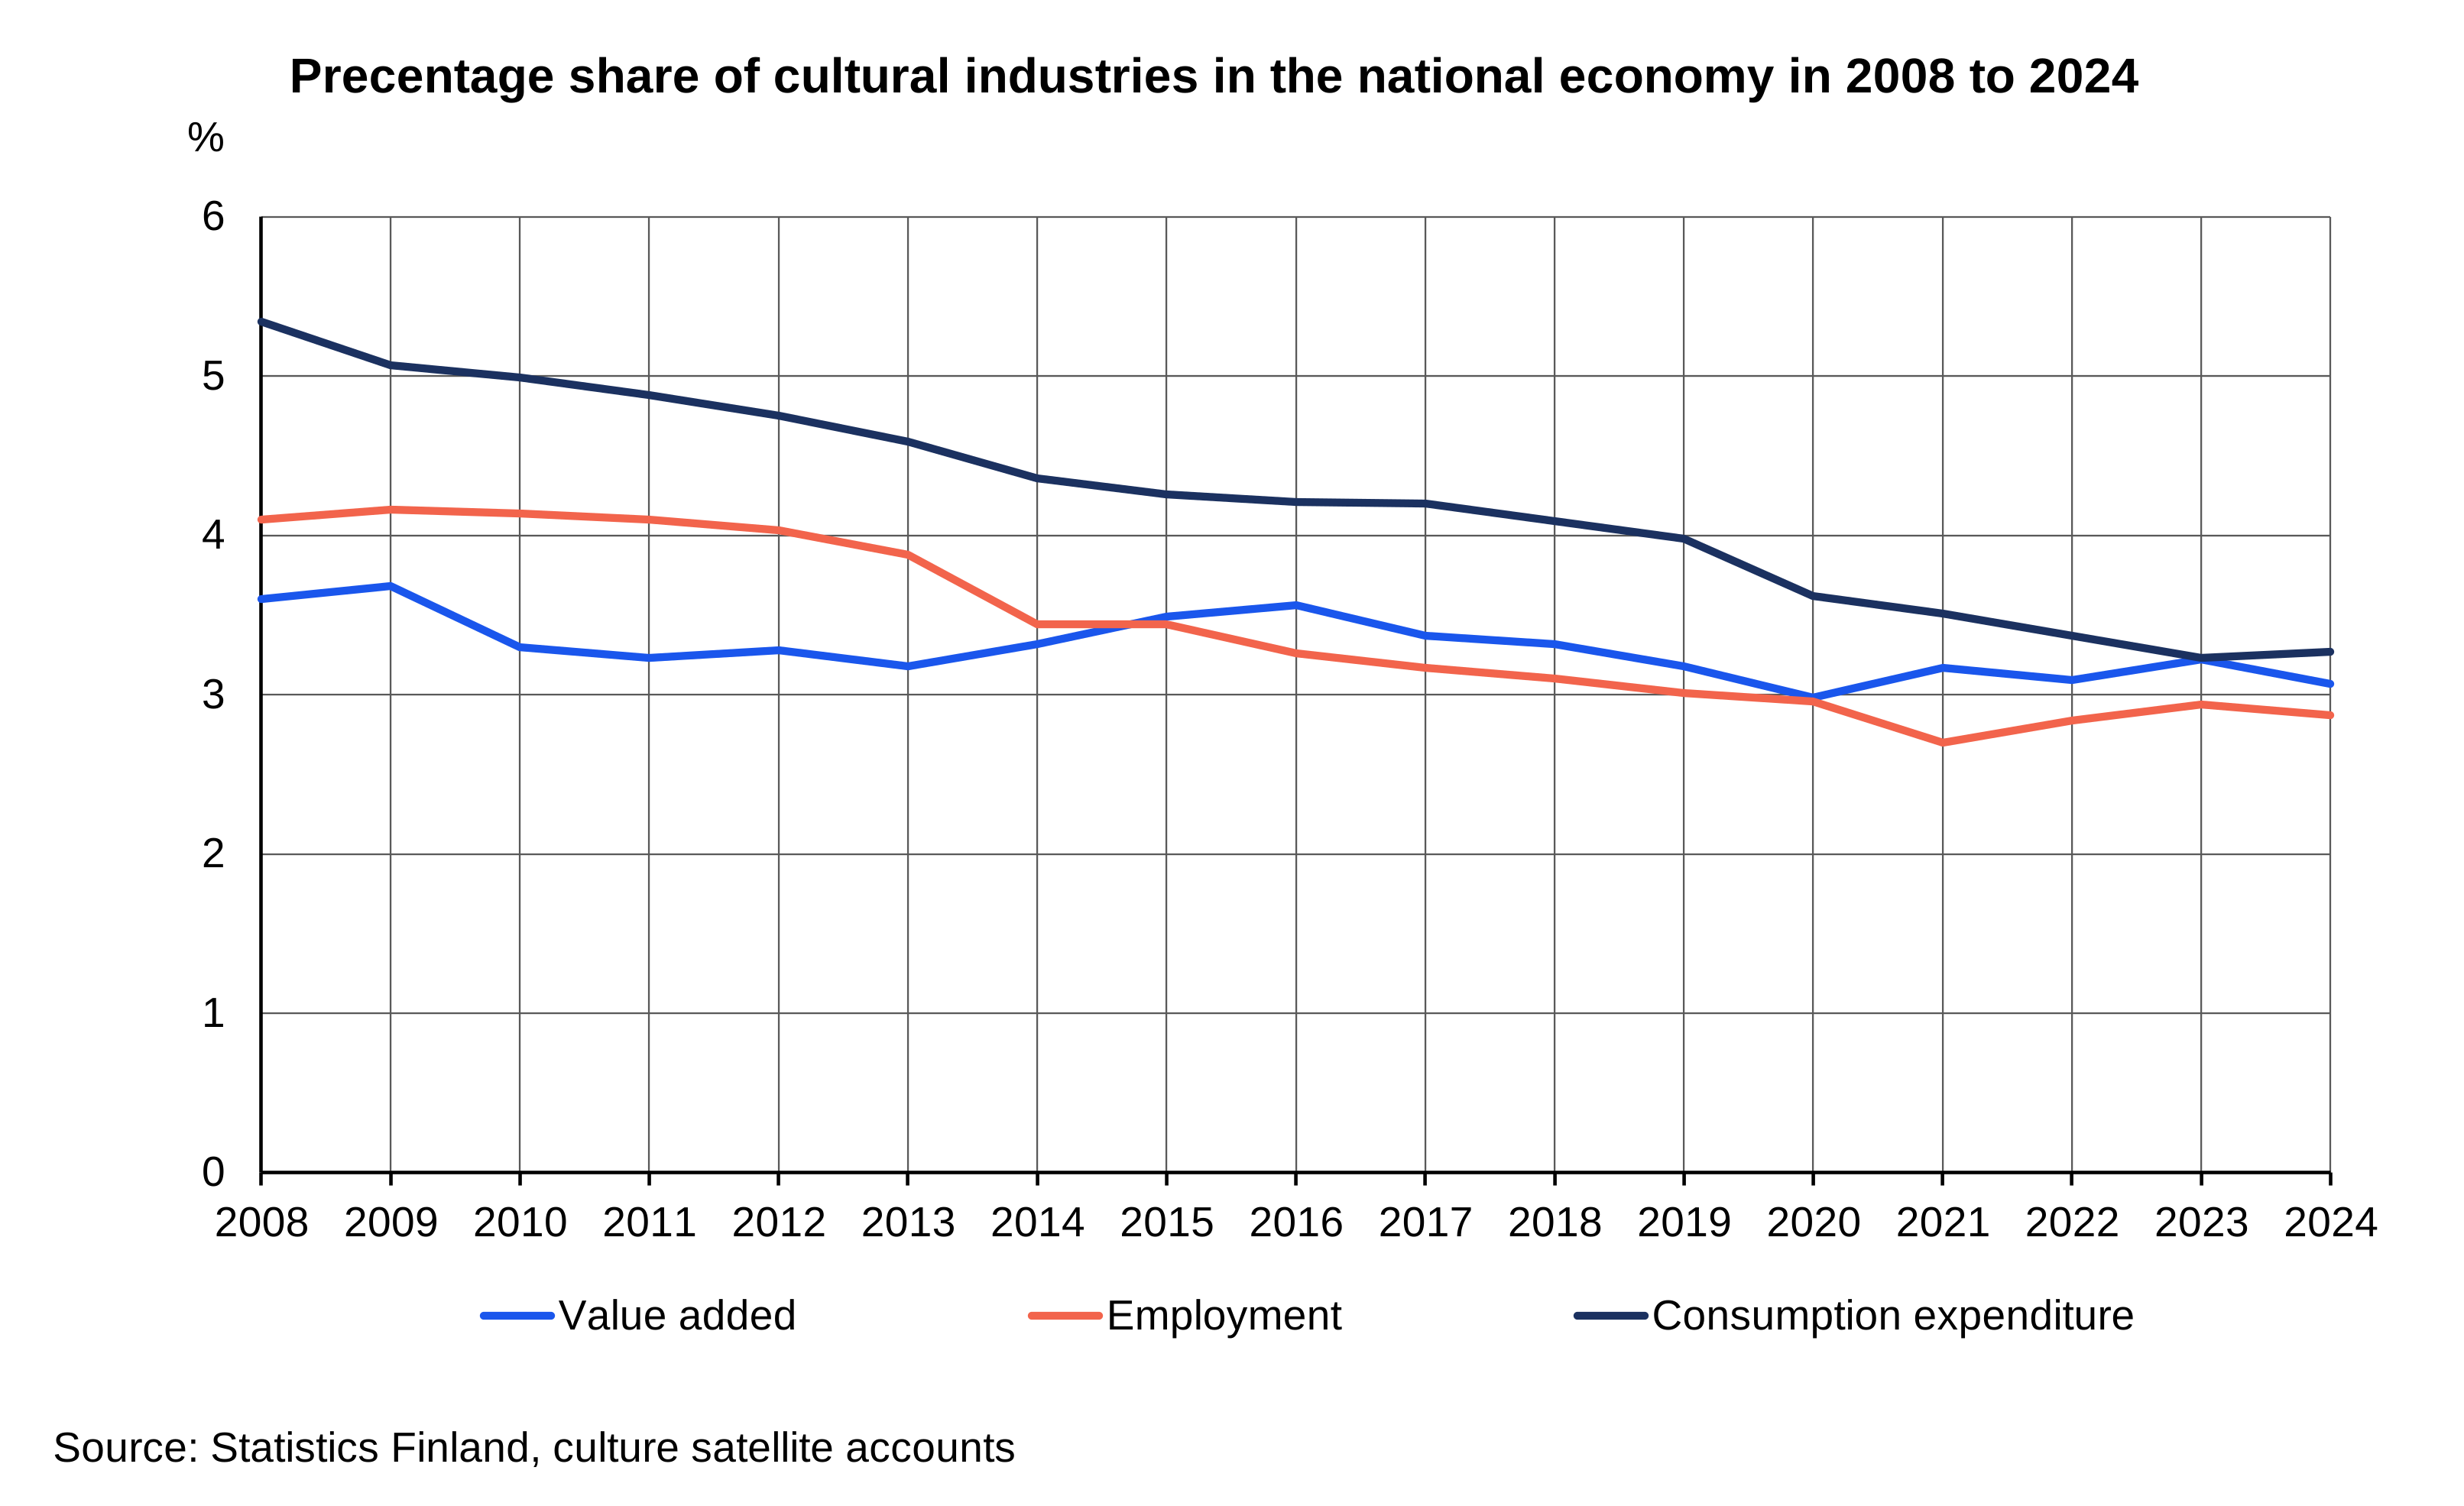
| 2009 | 2010 | 2011 | 2012 | 2013 | 2014 | 2015 | 2016 | 2017 | 2018 | 2019 | 2020 | 2021 | 2022 | 2023 | 2024 | |
|---|---|---|---|---|---|---|---|---|---|---|---|---|---|---|---|---|
| Artistic, theatre and concert activities | 9 | 8.8 | 8.5 | 8.7 | 9.4 | 9.2 | 8.7 | 8.7 | 9.3 | 9.9 | 11.1 | 9.4 | 8.7 | 9.7 | 9.5 | 11.6 |
| Libraries, archives, museums, etc. | 5 | 5.5 | 5.6 | 5.6 | 5.7 | 5.2 | 5.3 | 5 | 5.2 | 5.3 | 5.2 | 5.4 | 5.1 | 5.1 | 5.7 | 5.9 |
| Art and antique shops | 0.1 | 0.1 | 0.1 | 0.1 | 0.2 | 0.2 | 0.2 | 0.2 | 0.1 | 0.2 | 0.1 | 0.1 | 0.1 | 0.1 | 0.1 | 0.1 |
| Production and distribution of books | 6.2 | 6.5 | 6.2 | 6.5 | 6.3 | 6.3 | 6 | 6.8 | 7.4 | 7.7 | 7.8 | 8.1 | 7.3 | 6.6 | 7.3 | 7.1 |
| Newspapers, periodicals and news agencies | 19.4 | 18 | 17.9 | 17.3 | 14.9 | 13.5 | 11.8 | 10.8 | 11.8 | 13 | 12.2 | 11 | 10.3 | 9.3 | 8.7 | 8.5 |
| Motion pictures, videos and computer games | 4.7 | 5.7 | 6.6 | 9.7 | 11.8 | 15.4 | 21 | 21.3 | 19.2 | 17.1 | 16.1 | 18.4 | 22.3 | 22.3 | 23.5 | 17.1 |
| Manufacture and sale of musical instruments | 0.2 | 0.2 | 0.2 | 0.2 | 0.2 | 0.2 | 0.2 | 0.2 | 0.2 | 0.2 | 0.2 | 0.3 | 0.2 | 0.2 | 0.2 | 0.2 |
| Sound recordings | 0.8 | 1.1 | 1 | 1.2 | 1.4 | 1.5 | 1.4 | 1.6 | 1.6 | 2.1 | 2.1 | 1.2 | 1.2 | 1.4 | 1.6 | 1.4 |
| Radio and television | 8.7 | 9.9 | 9.9 | 7.9 | 6.8 | 7.7 | 6.6 | 5.8 | 6.5 | 5.3 | 6.1 | 8.4 | 7.4 | 6.6 | 5.8 | 6.4 |
| Printing and related activities | 10.1 | 9.4 | 8.3 | 8.2 | 7.6 | 6.9 | 6.1 | 5.7 | 5.4 | 5 | 4.8 | 4.5 | 3.9 | 3.9 | 4.4 | 4.3 |
| Advertising | 9.8 | 11.3 | 11.4 | 11.2 | 10.8 | 10.2 | 9.5 | 9.4 | 9.9 | 10 | 10 | 9.8 | 9.8 | 9.9 | 9.1 | 9.4 |
| Architectural and industrial design | 5.7 | 5.6 | 5.8 | 5.7 | 5.7 | 5.5 | 5.6 | 6.1 | 5.9 | 6.2 | 6.7 | 7.2 | 6.7 | 6.7 | 5.6 | 5.2 |
| Photography | 1.9 | 1.8 | 1.4 | 1.4 | 1.4 | 1.2 | 1.3 | 1.5 | 1.2 | 1.2 | 1.1 | 1.1 | 1.3 | 1.2 | 1.1 | 1.4 |
| Amusement parks, games and other entertainment and recreation | 7.9 | 7.6 | 8.1 | 7.4 | 7.2 | 7.1 | 7.6 | 8.3 | 8.4 | 8.8 | 7.7 | 7.7 | 6.9 | 7.4 | 7.3 | 7.1 |
| Manufacture and sale of entertainment electronics | 2.8 | 1.8 | 2 | 1.8 | 1.7 | 1.7 | 1.8 | 1.5 | 1.8 | 1.6 | 1.6 | 1.9 | 1.9 | 1.8 | 1.5 | 1.4 |
| Organisation of cultural events and related activity | 4.2 | 3 | 3.1 | 3.3 | 3.9 | 3.3 | 3.2 | 3.6 | 2.7 | 3 | 3.5 | 1.7 | 3.5 | 4.3 | 5.2 | 9.3 |
| Education and cultural administration | 3.5 | 3.7 | 3.8 | 4 | 5.1 | 4.8 | 3.6 | 3.4 | 3.5 | 3.4 | 3.7 | 3.8 | 3.4 | 3.5 | 3.4 | 3.6 |
| Cultural industries, total | 100 | 100 | 100 | 100 | 100 | 100 | 100 | 100 | 100 | 100 | 100 | 100 | 100 | 100 | 100 | 100 |
Pick the data you need into tables, view the data as graphs, or download the data for your use.
