Published: 5 May 2021
Women are more at risk of poverty or social exclusion than men in nearly all European countries
Corrected on 31 May 2021. The corrections are indicated in red.
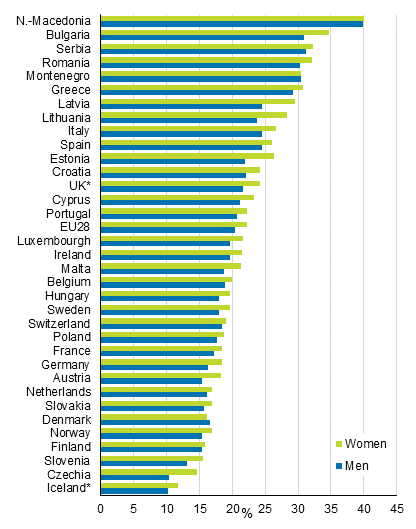
In most European countries, women's risk of poverty or social exclusion was higher than men's in 2018. Of the persons at risk of poverty or social exclusion in 28 EU countries, around 50 million were men and 57 million women in 2018. A total of 20.4 per cent of men and 22.3 per cent of women were at risk of poverty or social exclusion. Only in Denmark the risk experienced by men was slightly higher than that by women, but the difference is only 0.5 percentage points. The Baltic countries have the biggest differences in the risk experienced by women and men. Besides Denmark, the difference in the risk experienced by women and men is in Finland the smallest in the EU. These data derive from the European Union Statistics on Income and Living Conditions, where Finland's data are based on Statistics Finland’s statistics on living conditions.
Persons at risk of poverty or social exclusion by country and sex in 2018, %

Source: EU-SILC, Eurostat. Finland’s data are based on Statistics Finland’s statistics on living conditions. Data concerning Iceland and UK refer to 2017.
Being at risk of poverty or social exclusion means that the person is living in a low income household, a household with low work intensity or a household that experiences severe material deprivation (see concepts ). The person is at risk of poverty or social exclusion if at least one of these conditions is met, but they can also occur simultaneously.
For the most part, women's higher risk of poverty or social exclusion is explained by low income earning, which is the most significant risk component in nearly all countries and more common among women than men. In slightly more countries men experience more often low work intensity than women, which is most common after being at risk of poverty. For example, in the Baltic countries and Finland the share of men with low work intensity is higher than the share of women with low work intensity.
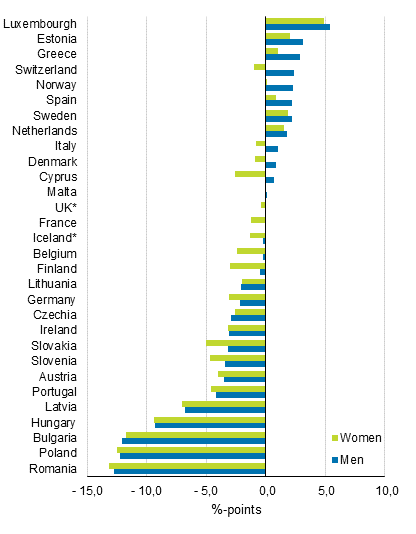
In most countries where data on the risk of poverty or social exclusion have been collected since 2007, the shares of both women and men at risk have decreased by 2018. Where the shares have changed greatly – especially in Eastern European countries in Romania, Poland, Bulgaria and Hungary – the share of persons at risk has fallen for both women and men. The share of persons at risk has grown for both women and men in Luxembourg, Estonia, Sweden and the Netherlands. As a rule, however, in countries where the changes in risk have been smaller, the changes have been more unevenly directed between women and men. For example, women's risk of poverty or social exclusion in Finland has decreased more than men's. Because the share of women at risk in Finland has originally been higher, the decrease has reduced the differences between the sexes.
Change in the share of persons at risk of poverty or social exclusion by country and sex from 2007 to 2018, percentage points. Countries are sorted by the change in men’s risk.

Source: EU-SILC, Eurostat. Finland’s data are based on Statistics Finland’s statistics on living conditions. Data concerning Iceland and UK refer to 2017.
Life satisfaction remained stable in 2020
Finns' satisfaction with life remained on average very stable in 2020. Satisfaction with life is asked yearly by asking how satisfied people are with their life in general on a scale of 0 to 10, where 0 means that they are not at all satisfied and 10 that they are completely satisfied. The average for the adult population was 8.1 in 2020, and despite small annual variations the level has remained the same throughout the measurement period, that is, since 2013.
Satisfaction with life varies by income, health and age. The average life satisfaction of adults feeling they were in very good health received the value 8.8, while that of those feeling they were in poor or very poor health received the value 6.3 (Table). The average life satisfaction of adults belonging to the highest income quintile was 8.5, while the average for the lowest income quintile was 7.7. – More detailed data on life satisfaction can be found in the database tables of the statistics on living conditions.
Mean of life satisfaction in household population aged 16 years or older by age and self-perceived health in 2020 1)
| All age groups | 16–24 | 25–34 | 35–49 | 50–64 | 65–74 | 75– | |
| All | 8,1 | 8,2 | 8,0 | 8,2 | 8,1 | 8,2 | 8,1 |
| Very good health | 8,8 | 8,7 | 8,6 | 8,7 | 9,0 | 8,9 | 9,1 |
| Good health | 8,3 | 8,3 | 8,1 | 8,3 | 8,4 | 8,6 | 8,7 |
| Fair health | 7,6 | 6,9 | 6,9 | 7,4 | 7,5 | 7,8 | 7,9 |
| Bad or very bad health | 6,3 | . | . | 6,3 | 6,3 | 6,7 | 6,5 |
The data collection for 2020 took place in the middle of the corona pandemic so that the data collection period of the survey was halfway through when corona restrictions entered into force. Thus, the possible impact of the pandemic on general satisfaction with life can only be partially reflected in the data for 2020. As the data collection for 2021 is ongoing, the pandemic has already continued for a year, so the long-term effects on experienced well-being may be visible when releasing data for the next survey year.
Source: Statistics on living conditions 2020, Statistics Finland
Inquiries: Kaisa-Mari Okkonen 029 551 3408
Head of Department in charge: Hannele Orjala
Publication in pdf-format (191.9 kB)
- Tables
-
Tables in databases
Pick the data you need into tables, view the data as graphs, or download the data for your use.
Updated 05.05.2021
Official Statistics of Finland (OSF):
Statistics on living conditions [e-publication].
02 2020. Helsinki: Statistics Finland [referred: 22.2.2026].
Access method: http://stat.fi/til/eot/2020/02/eot_2020_02_2021-05-05_tie_001_en.html

