

1. Persons who voted in European Parliamentary elections 2019
This review examines persons entitled to vote and those who voted in the European Parliament elections 2019 according to various background factors. The data on persons entitled to vote and those who voted derive from the voting register of the Election Information System of the Ministry of Justice. The unit-level background data are based on Statistics Finland’s data, such as population, employment and family statistics, and the Register of Completed Education and Degrees. The groups under examination are, on the one hand, persons entitled to vote and advance voters in the whole country, and, on the other hand, persons entitled to vote and those who voted in voting districts where an electronic voting register was in use in the European Parliament elections 2019.
The electronic voting register enables examination of voting turnout also in terms of votes cast on the election day. These data provide a complete picture of voting turnout as they can reliably help take into account those who did not vote. This is not possible for the data containing only advance voters. In this review, advance voters refer to all persons that voted in advance throughout the country and all who voted refer to both advance voters and those who voted on the election day in the above-mentioned districts.
The data presented in the review concerning all who voted do not cover the entire country or all persons entitled to vote. In this review, all who voted refer to the actual event of voting in those districts on which data were available. The data presented in this review have not been edited in any way, for example, by weighting the data based on background factors, but the breakdowns are presented as they are in the data. In other words, the data presented on all who voted in a particular area only apply to the municipalities, voting districts and persons entitled to vote for which data were available.
Analysed data
The analyses include two separate, but partly overlapping, voter groups. The following terms are used for these voter groups in the text, tables and figures of the review:
-
Advance voters that cover all persons who voted in advance in the European Parliamentary elections throughout the country;
-
All who voted in the areas that cover both advance voters and persons who voted on the election day (that is, all who voted) in the voting districts that used the electronic voting register.
The voter groups used in the review are not mutually exclusive. The advance voters of the entire country also include the persons entitled to vote who voted in advance in the above-mentioned areas. All who voted in the areas also include all persons that voted in advance in those particular areas. Thus, the group “advance voters” depicts, just like the name suggests, persons entitled to vote who voted in advance in the entire country, and the group “all who voted in the areas” covers persons who voted on the election day and in advance in a limited number of voting districts.
The data of the review are limited to Finnish citizens living in Finland, so the data do not include citizens of other EU countries entitled to vote living in Finland. With this limitation, there were 4,256,326 persons entitled to vote in the European Parliament elections 2019. Of these persons entitled to vote, 904,404, or 21.2 per cent of all persons entitled to vote, voted in advance.
The voting districts where data on voting on the actual election day are available had 1,782,138 persons entitled to vote. So, complete voting data are available for 41.9 per cent of persons entitled to vote. Of those entitled to vote, for whom voting data was also available for the election day in the 2019 European Parliament elections, 99.2 per cent were the same persons as in the corresponding group in the 2019 Parliamentary elections.
All unit-level background data cannot be linked to all persons entitled to vote. In terms of individual background variables used, for example, the numbers of persons entitled to vote can be lower than the above-mentioned numbers. In practice, this is visible, for example, in that the distributions presented in the figures and tables may vary slightly by background variable.
Data coverage
The municipalities and voting districts for which all voting data were received are not divided entirely equally on the level of the whole country. Data on voting on the actual election day were available from 143 municipalities, from 88 municipalities completely and for 55 municipalities from some of the voting districts.
Voting data from the election day were available from all Mainland Finland constituencies. However, the coverage of the data varied by constituency. The most comprehensive data were available from the constituency of Central Finland, 83.0 per cent of persons entitled to vote in the constituency. Data were also more comprehensive than the average for the entire country in the constituencies of Oulu (74.8% of persons entitled to vote), Lapland (70.7%), Pirkanmaa (59.5%), Uusimaa (48.1%) and Satakunta (48.0%). The coverage for election day voting data was lowest in the Helsinki constituency where data were available only for two voting districts and for 1.4 per cent of persons entitled to vote. In other words, those entitled to vote in the Helsinki constituency were clearly under-represented in the available data. (See Appendix table 1)
Appendix table 2 examines the background factors of persons entitled to vote in the entire country and in the areas with complete voting data. In the European Parliament elections 2019, the average age of persons entitled to vote was 51.0. In this respect, the persons entitled to vote in certain areas do not considerably differ from those entitled to vote in the entire country. Of all persons entitled to vote, men represented 48.6 per cent in the whole country, as many as in the areas in relative terms.
The median for the disposable income of persons entitled to vote in the whole country was slightly higher than that of persons entitled to vote in the areas. The difference is around EUR 300 per year.
As regards the level of education, the examined areas do not essentially differ from the whole country. In the whole country, persons entitled to vote were, on average, slightly more highly educated than in the examined areas with the electronic voting register. The difference is, in practice, only visible in the highest examined group of education. There were 1.2 percentage points more persons with higher tertiary level or doctorate level education in the whole country than in the areas. As regards education, the under-representation of the constituency of Helsinki, and, e.g. Turku and Espoo missing from the data, affects the distributions of the data.
Differences between all persons entitled to vote and persons entitled to vote living in the areas are small when it comes to main type of activity categories. There were slightly more employed persons (0.5 percentage points) in the whole country than in the areas and correspondingly, the areas had more students (0.5 percentage points). In turn, the number of pensioners was, in relative terms, equal in the areas and in the whole country.
There were slightly more Finnish-speaking persons entitled to vote in the areas (1.8 percentage points) than in the whole country. There were some differences in parties’ support in the European Parliament elections 2019 between the areas and the whole country. Support for the Centre Party of Finland, the Finns Party and the Social Democratic Party was slightly higher in the areas than in the whole country. Correspondingly, support for the Coalition Party, the Green League and the Swedish People's Party was lower in the areas than in the whole country. There were no significant differences in the support of other parties between the areas and the whole country.
The factors presented in Appendix tables 1 and 2 should be considered if the data obtained on all who voted in the areas with an electronic voting register are to be generalised to relate to all persons entitled to vote.
Age and sex
In the European Parliament elections 2019, a total of 904,404 Finnish citizens entitled to vote resident in Finland voted in advance, which represents 21.2 per cent of all persons entitled to vote living in Finland. The advance voting percentage reported by Statistics Finland is 49.7. The advance voting percentage is derived by calculating the share of advance voters among those having voted. In this review, persons who voted are examined in relation to persons entitled to vote, so the percentages given are lower than the advance voting percentage.
In the voting districts where all voting data were available, a total of 726,467 persons entitled to vote cast their vote, which was 40.8 per cent of the persons entitled to vote in the areas. In these areas, 21.1 per cent of persons entitled to vote voted in advance and 19.7 per cent voted on the election day.
Age clearly had an impact on voting. The share of advance voters in the whole country among persons entitled to vote exceeds 30 per cent at the age of 64, after which the share grows faster than earlier. Advance voting was most common among persons aged 75, of whom 40.5 per cent voted in advance. The share of advance voters falls under 30 per cent among persons aged 83. (Figure 1.)
Figure 1. Share of those who voted among persons entitled to vote by age in the European Parliament elections 2019, %
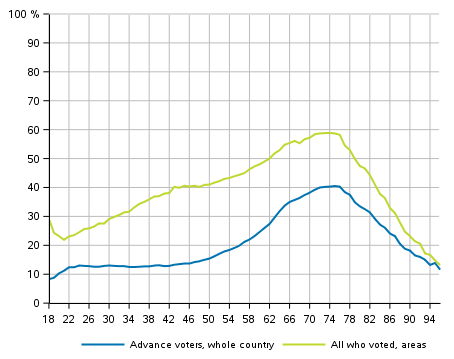
In areas where voting data on the election day were also obtained, the voting percentage of those aged 18 was 29.1. The voting percentage drops to 21.9 per cent in the group of persons aged 21. After this, the voting percentage grows quite evenly to 40.2 per cent among persons aged 43. The voting percentage is at its highest in the group of persons aged 74 (58.9 %). For persons aged 79 or over, the voting percentage drops below 50 per cent, and for those aged 91 the level is below that of persons aged 21. (Figure 1.)
Women voted more actively than men, particularly in the younger age groups. In the whole country, 22.5 per cent of women entitled to vote voted in advance, 2.6 percentage points more than men.
The voting percentage that takes into account all persons who voted was slightly higher for women than for men, among women, 0.9 percentage points more voted than men. Examined by age group, women voted more actively in all age groups, except in the age group aged 65 and over, however, in the age groups 35 to 54, the differences in voting turnout between sexes were small. The biggest difference in voting activity between the sexes was found in the youngest age groups, 18 to 24. (Table 1)
Table 1. Share of advance voters and all who voted among persons entitled to vote by sex and age in the European Parliament elections 2019, %
| Age group |
Total | Men | Women | |||
| Advance voters, whole country |
All who voted, areas |
Advance voters, whole country |
All who voted, areas |
Advance voters, whole country |
All who voted, areas |
|
| Total | 21.2 | 40.8 | 19.9 | 40.3 | 22.5 | 41.2 |
| 18-19 | 8.6 | 26.7 | 6.1 | 22.4 | 11.2 | 31.1 |
| 20-24 | 11.9 | 23.3 | 9.2 | 20.3 | 14.7 | 26.4 |
| 25-34 | 12.8 | 28.5 | 11.5 | 27.1 | 14.1 | 29.9 |
| 35-44 | 12.9 | 36.8 | 12.4 | 36.3 | 13.4 | 37.4 |
| 45-54 | 15.8 | 41.5 | 15.1 | 41.4 | 16.5 | 41.5 |
| 55-64 | 24.5 | 47.9 | 22.9 | 47.5 | 26.0 | 48.2 |
| 65-74 | 37.5 | 57.0 | 36.2 | 57.1 | 38.8 | 56.9 |
| 75- | 30.9 | 43.5 | 34.2 | 49.7 | 28.8 | 39.6 |
Main type of activity, education and family status
In an examination of groups of main type of activity, the voting activity among pensioners is emphasised. Measured by main type of activity, pensioners voted most actively in advance in the whole country, making up 48.5 per cent of all advance voters. In other groups of main type of activity, the share of advance voters was relatively smaller than their share among all persons entitled to vote. (Figure 2.)
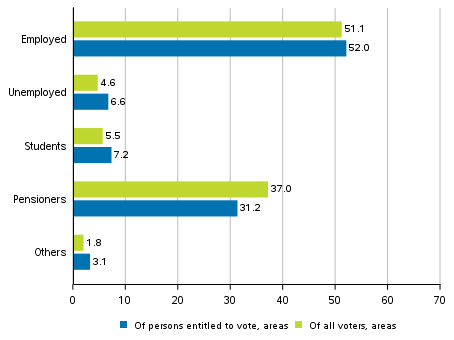
Also, among all persons who voted, only the share of the group pensioners was higher than the corresponding share of the group among all persons entitled to vote. The share of persons who voted in other groups of main type of activity was below the relative size of the groups among all persons entitled to vote. (Figure 3.)
Figure 2. Persons entitled to vote and advance voters in the whole country by main type of activity in the European Parliament elections 2019, %
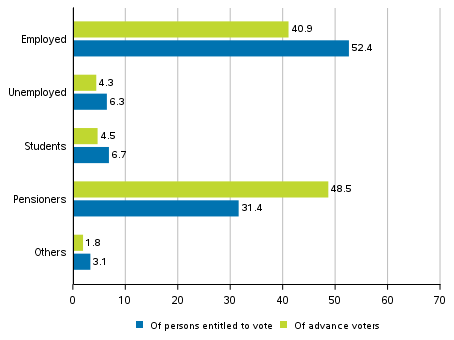
Figure 3. Persons entitled to vote and all who voted in the areas by main type of activity in the European Parliament elections 2019, %
High education increases the probability of voting also in European Parliament elections. The voting percentage of persons with higher tertiary or doctorate level education was 41.7 percentage points higher than among all persons entitled to vote with only basic level qualifications in areas.
The connection of age to voting turnout is also visible in the educational groups as, in practice, in all of them, voting activity grows with age, apart from the oldest age group. Voting turnout of more than 80 per cent is only achieved among those with at least higher university degrees in the age groups 65 to 74. (Table 2)
Table 2 also shows that education for lowest tertiary level qualifications has been abolished in Finland and such qualifications are no longer completed. Thus, the age structure of those who have completed this level of education differs from other education level groups. Lowest tertiary level education covers qualifications above upper secondary level that are not university of applied sciences degrees.
Table 2. Share of advance voters and all who voted among persons entitled to vote by age and level of education in the European Parliament elections 2019, %
| Total | Lower secondary |
Upper secondary |
Lowest tertiary |
Lower tertiary |
Higher tertiary, doctorate |
||
| Total | Advance voters, whole country |
21.2 | 16.7 | 17.2 | 32.4 | 24.3 | 34.0 |
| All who voted, areas |
40.8 | 29.2 | 33.7 | 58.1 | 51.4 | 70.9 | |
| 18-24 | Advance voters, whole country |
11.0 | 7.7 | 13.2 | .. | 28.2 | .. |
| All who voted, areas |
24.2 | 22.3 | 25.1 | .. | 46.9 | .. | |
| 25-34 | Advance voters, whole country |
12.8 | 5.0 | 9.1 | 9.4 | 18.8 | 28.5 |
| All who voted, areas |
28.5 | 10.8 | 22.0 | 19.2 | 41.8 | 61.4 | |
| 35-44 | Advance voters, whole country |
12.9 | 6.4 | 9.1 | 11.9 | 14.6 | 22.6 |
| All who voted, areas |
36.8 | 15.9 | 26.7 | 38.1 | 44.1 | 63.5 | |
| 45-54 | Advance voters, whole country |
15.8 | 8.6 | 12.3 | 17.5 | 18.6 | 26.1 |
| All who voted, areas |
41.5 | 20.3 | 31.7 | 47.0 | 51.5 | 70.0 | |
| 55-64 | Advance voters, whole country |
24.5 | 15.0 | 20.2 | 29.8 | 33.1 | 40.2 |
| All who voted, areas |
47.9 | 29.1 | 40.3 | 57.7 | 65.3 | 77.8 | |
| 65-74 | Advance voters, whole country |
37.5 | 27.0 | 34.4 | 48.8 | 54.9 | 60.3 |
| All who voted, areas |
57.0 | 42.7 | 53.8 | 71.8 | 80.3 | 86.4 | |
| 75- | Advance voters, whole country |
30.9 | 22.4 | 32.8 | 47.6 | 53.4 | 60.6 |
| All who voted, areas |
43.5 | 33.0 | 47.3 | 64.6 | 71.1 | 80.0 | |
The family status of persons who voted is examined by means of certain family status groups. Attention is paid to married or cohabiting couples (partnerships) and those without a family, the number of children and the age of persons entitled to vote.
Those in partnerships voted in the areas clearly more than those without a family, the voting percentage of married or cohabiting couples was over 10 percentage points higher than that of those without a family. The voting turnout of parents of one-parent families remained at 26.5 per cent.
When examining the voting turnout of young people aged 18 to 24, we can see that the voting turnout of those living at home (with their parents) was higher than of those of the same age not belonging to families. Those not belonging to a family include both those living alone and with another person or other persons. The difference in the groups’ voting turnout in the areas was slightly under four percentage points.
An age group specific examination of all who voted does not significantly change the picture of the effect of family status. As a rule, the voting percentage grows in all family status groups by age, apart from the oldest age group of people aged 75 and over. For the family status, the group “Other” includes those aged over 24 living at home, parents of one-parent families living with their adult child, the institutional population and unclassified persons and those whose family status is unknown. (Figure 4, Table 3)
Figure 4. Share of those who voted among persons entitled to vote by age in certain family status groups in the European Parliament elections 2019, %
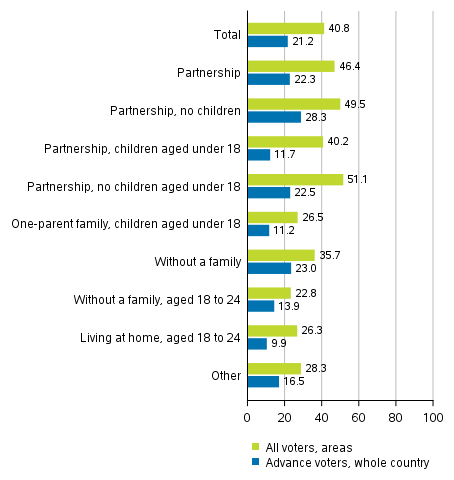
Table 3. Share of advance voters in the whole country and all who voted in the areas by family status in the European Parliament elections 2019, %
| Total | Partner- ship |
Partner- ship, no children |
Partner- ship, children aged under 18 |
Partner- ship, no children aged under 18 |
One- parent family, children aged under 18 |
Without a family |
Other | ||
| Total | Advance voters, whole country |
21.2 | 22.3 | 28.3 | 11.7 | 22.5 | 11.2 | 23.0 | 16.5 |
| All voters, areas |
40.8 | 46.4 | 49.5 | 40.2 | 51.1 | 26.5 | 35.7 | 28.3 | |
| 18-24 | Advance voters, whole country |
11.0 | 9.9 | 10.8 | 3.5 | .. | 3.3 | 13.9 | 8.4 |
| All voters, areas |
24.2 | 21.5 | 22.6 | 13.5 | .. | 6.3 | 22.8 | 12.9 | |
| 25-34 | Advance voters, whole country |
12.8 | 11.7 | 14.8 | 8.2 | .. | 5.6 | 15.2 | 12.7 |
| All voters, areas |
28.5 | 30.6 | 33.9 | 27.2 | .. | 12.3 | 27.8 | 24.5 | |
| 35-44 | Advance voters, whole country |
12.9 | 11.9 | 16.2 | 10.9 | 8.5 | 10.1 | 17.0 | 14.6 |
| All voters, areas |
36.8 | 39.6 | 39.4 | 39.7 | 27.3 | 25.4 | 33.1 | 26.1 | |
| 45-54 | Advance voters, whole country |
15.8 | 14.8 | 16.8 | 13.7 | 15.3 | 14.4 | 19.0 | 16.3 |
| All voters, areas |
41.5 | 45.0 | 40.1 | 47.7 | 44.3 | 34.7 | 34.4 | 31.0 | |
| 55-64 | Advance voters, whole country |
24.5 | 24.6 | 25.7 | 19.4 | 23.1 | 19.4 | 24.9 | 21.6 |
| All voters, areas |
47.9 | 52.0 | 51.0 | 54.4 | 54.6 | 42.2 | 40.2 | 36.7 | |
| 65-74 | Advance voters, whole country |
37.5 | 39.3 | 39.8 | 29.1 | 33.6 | 31.0 | 34.8 | 27.9 |
| All voters, areas |
57.0 | 61.6 | 61.7 | 60.3 | 59.7 | 58.1 | 48.9 | 38.9 | |
| 75- | Advance voters, whole country |
30.9 | 36.5 | 36.9 | .. | 27.6 | .. | 27.1 | 14.6 |
| All voters, areas |
43.5 | 53.2 | 53.5 | .. | 45.7 | .. | 36.3 | 19.9 | |
Income level and occupation
The income level of those who voted, and persons entitled to vote is examined with the help of disposable monetary income. Income data derive from the latest taxation data from 2017. Disposable monetary income refers to monetary income after taxes. These consist of earned income, property income, benefits in kind and transfer income.
In the data of the review, the income of persons entitled to vote is divided into deciles. Income deciles are derived by arranging persons entitled to vote by income and by dividing the group into ten equal parts. The groups formed in this way each have around 425,000 persons entitled to vote for all persons entitled to vote in the whole country. In the areas from which data were received on voting on the election day as well, the groups have around 178,000 persons entitled to vote each.
For the whole country, income data are missing for some 7,500 persons entitled to vote. In the data for areas containing election day votes, the income level was missing for some 2,400 persons entitled to vote. The median for the disposable income of all persons entitled to vote was EUR 21,500, in the examined areas the corresponding median income was EUR 21,200. The disposable income of persons entitled to vote in the whole country belonging to the highest income decile was at least EUR 39,648 and in the examined areas it was EUR 38,410 per year. The income for those belonging to the lowest income decile was at most EUR 9,359 for persons entitled to vote in the whole country and EUR 9,167 per year in the areas. (Table 4)
Table 4. Lowest limits for the income deciles of persons entitled to vote in 2019, EUR
| Decile | All persons entitled to vote |
Persons entitled to vote in areas |
| 1st decile | 0 | 0 |
| 2nd decile | 9,260 | 9,168 |
| 3rd decile | 13,102 | 13,029 |
| 4th decile | 15,698 | 15,571 |
| 5th decile | 18,419 | 18,191 |
| 6th decile | 21,477 | 21,163 |
| 7th decile | 24,540 | 24,184 |
| 8th decile | 27,727 | 27,288 |
| 9th decile | 31,972 | 31,335 |
| 10th decile | 39,648 | 38,410 |
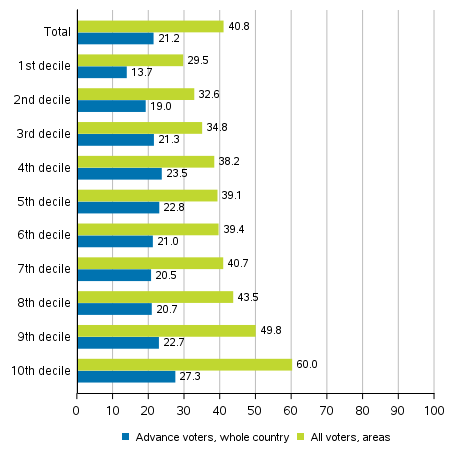
On the level of the whole country, the level of income as a whole does not have a substantial connection on advance voting. In the lowest income decile, advance voting is relatively lower than in the higher income brackets. Starting from the second income decile, there are no major changes in the rate of advance voting, the share of advance voting in these categories varies from 19.0 to 27.3 per cent. (Figure 5.)
When examining all who voted in the areas, the effect of income on voting turnout is evident. As a rule, voting is more common in higher income groups than in lower income groups. However, in the income deciles 4 to 7, voting turnout was around 40 per cent. In all, 60.0 per cent of those belonging to the highest income decile voted. By contrast, the voting turnout remained at 29.5 per cent in the lowest income decile. Thus, the difference between the voting turnout of the lowest and highest income earners was over 30 percentage points. (Figure 5.)
Figure 5. Share of those who voted among persons entitled to vote by income decile in the European Parliament elections 2019, %
The occupations of those entitled to vote is examined with the Classification of Occupations. The occupation data used is from 2016. The occupation is determined on the last day of the year for persons who, based on their main type of activity, are employed. The occupation data for those entitled to vote in the European Parliament elections 2019 is available for around 2,100,000 persons entitled to vote. In the examined areas, the corresponding data is available for some 870,000 persons entitled to vote.
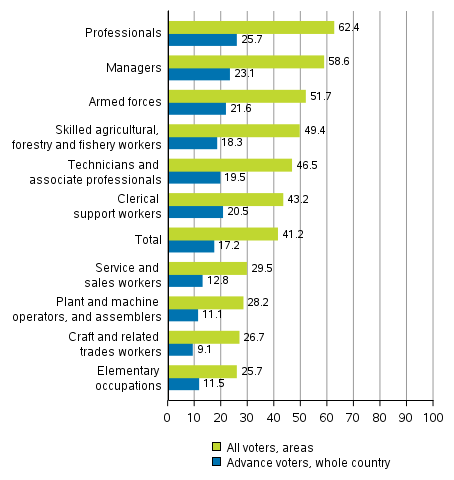
The voting turnout for all persons entitled to vote for whom occupation data is available in the examined areas was 41.2 per cent. Among occupational groups, professionals had the highest voting turnout, 62.4 per cent. The 50 per cent level was also exceeded by managers and armed forces personnel. (Figure 6.)
Voting turnout was lowest in elementary occupations, where it was 25.7 per cent, which is more than 15 percentage points below the average of occupational groups. The elementary occupations group includes auxiliary, routine-like jobs that require only little education.
Figure 6. Share of those who voted among persons entitled to vote by occupational group in the European Parliament elections 2019, %
Foreign background
The background of persons entitled to vote and persons who voted is viewed by means of language and origin. There was no difference in the voting turnout of Finnish and Sami speakers compared to all persons entitled to vote. By contrast, the voting turnout of Swedish speakers was more than 12 percentage points higher than the turnout among all persons entitled to vote.
Of all persons entitled to vote, 92.1 per cent were Finnish speakers, 5.2 per cent Swedish speakers and 2.5 per cent other language speakers. In the areas for which data were available for all who voted, 93.9 per cent spoke Finnish as their native language, 4.0 per cent Swedish and 2.0 per cent other languages. The share of Sami speakers was 0.03 per cent in both cases.
Table 5. Share of those who voted among persons entitled to vote by sex and language in the European Parliament elections 2019, %
| Sex | Total | Finnish, Sami |
Swedish | Other language |
||||
| Advance voters, whole country |
All who voted, areas |
Advance voters, whole country |
All who voted, areas |
Advance voters, whole country |
All who voted, areas |
Advance voters, whole country |
All who voted, areas |
|
| Total | 21.2 | 40.8 | 21.5 | 40.7 | 22.9 | 53.4 | 8.0 | 18.3 |
| Men | 19.9 | 40.3 | 20.2 | 40.2 | 21.1 | 52.2 | 8.5 | 18.8 |
| Women | 22.5 | 41.2 | 22.8 | 41.2 | 24.8 | 54.6 | 7.7 | 17.9 |
The voting turnout of foreign-language speakers was clearly lower than for those speaking national languages. Of all foreign-language speakers entitled to vote in the whole country, 8.0 per cent voted in advance. Correspondingly, among all who voted in the areas, 18.3 per cent of foreign-language speakers voted, which was 22 percentage points fewer than for all persons entitled to vote. (Table 5)
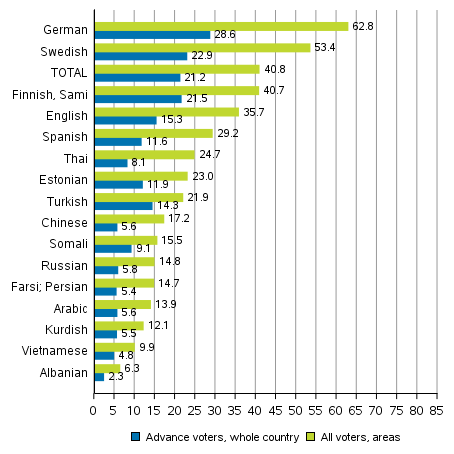
A more detailed examination of the voting turnout of different language groups shows that the voting turnout among all votes cast in the areas was highest for German speakers (62.8%). The voting turnout of Swedish speakers was 53.4 and that of Finnish and Sami speakers 40.7 per cent. Figure 7 includes the largest language groups measured by absolute numbers in the areas for which data were also available for election day voting. (Figure .)
Figure 7. Share of those who voted among persons entitled to vote by language in the European Parliament elections 2019, %
Examined by age group and origin, young people’s voting turnout was lower than in older age groups both among persons of Finnish background and of foreign background. This is visible both among advance voters in the whole country and all who voted in the areas. For all who voted in the areas, the difference between voting turnout among persons of Finnish and foreign background was over 22 percentage points. (Table 6)
Table 6. Share of those who voted among persons entitled to vote by origin and age in the European Parliament elections 2019, %
| Age group |
Total population |
Persons with Finnish background |
Persons with foreign background |
|||
| Advance voters, whole country |
All who voted, in areas |
Advance voters, whole country |
All who voted, in areas |
Advance voters, whole country |
All who voted, in areas |
|
| Total | 21.2 | 40.8 | 21.6 | 41.2 | 8.6 | 19.0 |
| 18-24 | 11.0 | 24.2 | 11.2 | 24.6 | 4.3 | 9.8 |
| 25-34 | 12.8 | 28.5 | 13.1 | 29.0 | 5.6 | 12.2 |
| 35-44 | 12.9 | 36.8 | 13.2 | 37.4 | 6.1 | 17.2 |
| 45-54 | 15.8 | 41.5 | 16.0 | 42.0 | 7.8 | 20.6 |
| 55-64 | 24.5 | 47.9 | 24.7 | 48.2 | 11.2 | 25.0 |
| 65-74 | 37.5 | 57.0 | 37.7 | 57.1 | 20.7 | 37.5 |
| 75- | 30.9 | 43.5 | 31.0 | 43.6 | 25.3 | 38.4 |
Source: European Parliament Elections 2019, Statistics Finland
Inquiries: Sami Fredriksson 029 551 2696, Jaana Asikainen 029 551 3506, vaalit@stat.fi
Director in charge: Jari Tarkoma
Updated 12.7.2019
Official Statistics of Finland (OSF):
European Parliament elections [e-publication].
ISSN=1798-291X. 2019,
1. Persons who voted in European Parliamentary elections 2019
. Helsinki: Statistics Finland [referred: 21.7.2026].
Access method: http://stat.fi/til/euvaa/2019/euvaa_2019_2019-07-12_kat_001_en.html