Published: 17 June 2010
Mass media market 2009 - Preliminary data
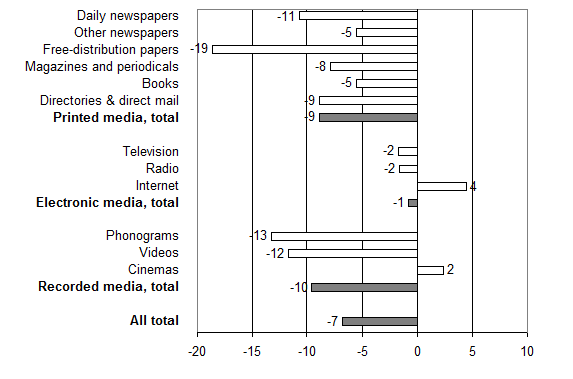
The media market lost seven per cent of its value in 2009. This represents the biggest annual drop in post-war time. For example, during the recession in the early 1990s annual changes ranged around -3 to -4 per cent.
The fall particularly concerned printed mass media (-9%) and recordings (-10%). Electronic mass media made do with an about one per cent drop. The turnover from Internet media contents even grew by some four per cent.
Figure 1. Changes in mass media markets 2008 - 2009 (%)

The value of the Finnish mass media market was in 2009 around EUR 4.1 billion, which is EUR 300 million less than in 2008. The majority of this sum, about EUR 260 million, disappeared from printed media, or in other words, publishing of magazines, books and directories.
The share of printed mass media in the value of the mass media market contracted by 1.5 percentage points to 65 per cent. The relative share of electronic mass media in the mass media market grew by nearly two percentage points to 28 per cent.
Table 1. Mass media market volume in Finland 2008-2009
| 2008 | 2009 | 2009 | |
| EUR million | EUR million | % | |
| Daily newspapers (7-4 times a week) | 1 056 | 943 | 23 |
| Other newspapers (3-1 times a week) | 135 | 127 | 3 |
| Free-distribution papers | 100 | 81 | 2 |
| Magazines and periodicals | 760 | 700 | 17 |
| Books* | 566 | 535 | 13 |
| Directories & direct mail | 340 | 310 | 8 |
| Printed media, total | 2 956 | 2 696 | 65 |
| Television** | 948 | 932 | 23 |
| Radio | 53 | 52 | 1 |
| Internet | 158 | 165 | 4 |
| Electronic media, total | 1 159 | 1 150 | 28 |
| Phonograms | 98 | 85 | 2 |
| Videos | 153 | 135 | 3 |
| Cinemas | 58 | 59 | 1 |
| Recorded media, total | 309 | 279 | 7 |
| All total | 4 424 | 4 125 | 100 |
| * Also includes the sales of multimedia
recordings (CD-ROMs, etc.) by members of the Finnish Book Publishers Association. ** Also includes YLE public service radio. Source: Statistics Finland, Mass media and cultural statistics |
|||
The preliminary calculations presented here describe the mass media market at the end user level: for example, the figure on the newspaper market is comprised of retail priced subscription and single copy sales of newspapers, and their revenue from advertising. Overlaps have been eliminated. The figures cover domestic production and imports but not exports.
Source: Mass media and cultural statistics. Statistics Finland
Inquiries: Tuomo Sauri +358 9 1734 3449, joukkoviestimet.tilastokeskus@stat.fi
Director in charge: Ms Riitta Harala
- Tables
-
Tables in databases
Pick the data you need into tables, view the data as graphs, or download the data for your use.
Last updated 17.6.2010
Official Statistics of Finland (OSF):
Mass media statistics [e-publication].
ISSN=2323-6345. 2009. Helsinki: Statistics Finland [referred: 23.2.2026].
Access method: http://stat.fi/til/jvie/2009/jvie_2009_2010-06-17_tie_001_en.html

