Published: 20 November 2014
Share of the field of culture in the national economy continues to fall despite the rise of the games industry
Culture has conventionally been a very work-dominated activity. The fields of culture made up good four per cent of all employed persons in the whole national economy in 2012. These data derive from Statistics Finland's Culture Satellite Accounts. The games industry is one of the few clearly growing sub-areas of culture, although its significance in the whole cultural economy is not yet that big. Most of the activity of the games industry remains outside the limitations of the cultural satellite, but now separate calculations have been made on the whole games industry.
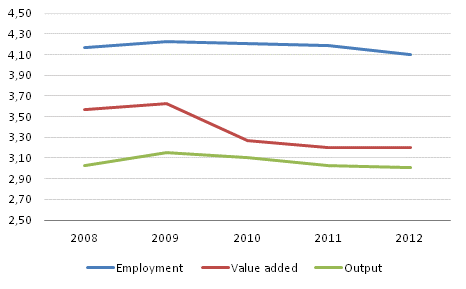
Share of industries of culture in the national economy 2008–2012 (ESA 2010)

The employment share of culture is in relative terms clearly higher than its shares of value added and output, which were good three per cent each. There are several reasons for the labour domination of culture: the employed in the fields of culture are very often working at a relative low pay level and cultural enterprises do not include that many companies that produce large profits. In addition, part-time employment is very common among the employed in several fields of culture.
Cultural activities have conventionally been regarded as a type of small-scale activity that balances economic trends. When a downturn hits, its role usually grows slightly because cultural activities include several permanent elements. The share of non-profit and public activities is significant and the role of various types of voluntary work is large there. For the most part, culture is not a primary route to riches, but culture is also produced in bad times even without making any profit. The employment and GDP shares of culture started to rise when the economic downturn began in the latter part of 2008 and their share grew during the worst year of downturn, 2009. The share went slightly down again when the national economy showed some signs of recovery in 2010. In 2012, both the employment and value added shares continued to grow, although only a little. Culture is thus not an actual growth engine except for a few individual fields, but it can be considered an indirect stimulus provider.
Transition to the ESA2010 system is also visible in the cultural satellite
The now published cultural satellite figures are in accordance with the new ESA2010 system. For these calculations, the most important individual change was capitalisation of R&D expenditure. The revision has not much effect on the actual cultural satellite calculations, but as the new calculation method raised the level of GDP by around four per cent, the share of culture diminished slightly. The methodological revision has decreased the relative share of culture by around 0.1 to 0.2 percentage points in 2008 to 2012.
Games industry stays mostly outside the current cultural satellite
Beside the culture satellite, Statistics Finland has also calculated total development between 2006 and 2012 for the games industry that has recently received much publicity. The games industry as a whole is one of the few growing sub-areas of culture. However, most game developer companies are working in the industry of programming, which is not included in the cultural satellite industries in these calculations. Only around ten per cent of the value added generated by games industry enterprises is produced inside the fields of culture. If games industry enterprises were as a whole included in the satellite, they would raise the value added of culture by approximately one to two per cent, output and intermediate consumption clearly more. Thus, the games industry is not a magic cure for the cultural economy - much less for the national economy.
The statistics on Culture Satellite Accounts depict the economic significance of culture, using the concepts and methods of National Accounts. Data according to the Standard Industrial Classification TOL 2008 have now been released for the years 2008 to 2012 in accordance with the ESA2010 system.
The data for the Culture Satellite Accounts are published on the statistics website as database tables.
Source: Culture Satellite Accounts, Statistics Finland
Inquiries: Katri Soinne 029 551 2778, Aku Alanen 029 551 3320, kansantalous@stat.fi
Director in charge: Leena Storgårds
Publication in pdf-format (222.2 kB)
- Tables
-
Tables in databases
Pick the data you need into tables, view the data as graphs, or download the data for your use.
Appendix tables
Updated 20.11.2014
Statistics:
Culture satellite accounts [e-publication].
ISSN=2323-9905. 2012. Helsinki: Statistics Finland [referred: 11.2.2026].
Access method: http://stat.fi/til/klts/2012/klts_2012_2014-11-20_tie_001_en.html

