

Published: 12 September 2012
Retail trade sales grew by 3.8 per cent in July
According to Statistics Finland, retail trade sales went up by 3.8 per cent in July from July 2011. The volume of retail trade sales, from which the impact of prices has been eliminated, remained on level with last year's July. In daily consumer goods trade, sales grew by 3.2 per cent and in department store trade by 3.7 per cent year-on-year. The development of sales was fastest in wholesale trade, where the rise from one year back amounted to 5.1 per cent. By contrast, sales in motor vehicle trade contracted by 15.2 per cent from the previous year's July. In total trade, sales increased by 2.1 per cent in July.
Annual change in turnover in trade industries, % (TOL 2008)
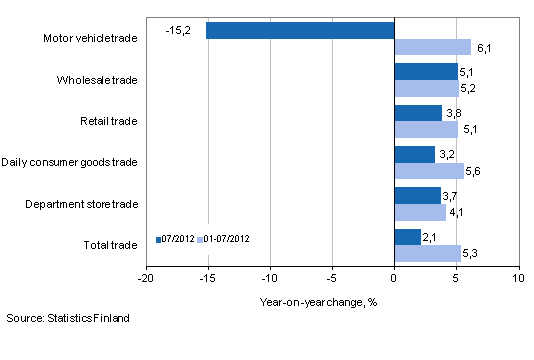
In the January to July period, sales in retail trade grew by 5.1 per cent and in wholesale trade by 5.2 per cent from the respective period of the year before. In motor vehicle trade, sales in the January to July period rose by 6.1 per cent from one year back. In the January to July period, sales in total trade went up by 5.3 per cent year-on-year.
Amended motor vehicle tax legislation influences motor vehicle trade sales in 2012
An amendment concerning the motor vehicle tax that is levied at first registration entered into force on 1 April 2012. According to it, the amount of tax is now based on the volume of carbon dioxide emissions that correspond with the combined consumption of the vehicle. The tax on passenger cars and vans rises if the emissions exceed 110g/km. The impacts of the amended taxation on motor vehicle prices will also be seen in the development of motor vehicle trade sales in 2012.
Source: Turnover of trade, Statistics Finland
Inquiries: Jarkko Niemistö 09 1734 2951, Tiina Talvio 09 1734 2698, palvelut.suhdanne@stat.fi
Director in charge: Hannele Orjala
Publication in pdf-format (246.4 kB)
- Tables
-
Tables in databases
Pick the data you need into tables, view the data as graphs, or download the data for your use.
Appendix tables
- Figures
- Revisions in these statistics
-
- Revisions in these statistics (12.9.2012)
Updated 12.9.2012
Official Statistics of Finland (OSF):
Turnover of trade [e-publication].
ISSN=1799-0939. July 2012. Helsinki: Statistics Finland [referred: 16.7.2026].
Access method: http://stat.fi/til/klv/2012/07/klv_2012_07_2012-09-12_tie_002_en.html