

Published: 15 April 2020
Turnover in trade grew by 1,2 per cent in February
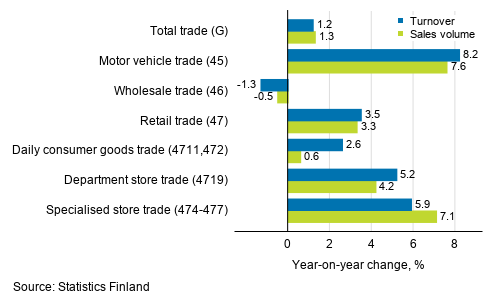
According to Statistics Finland, turnover in total trade adjusted for working days grew by 1.2 per cent in February from February 2019. Over the same period, the working day adjusted volume of sales, from which the impact of prices has been eliminated, rose by 1.3 per cent. Turnover grew in all sectors of trade apart from wholesale trade. Turnover in retail trade increased by 3.5 per cent and in motor vehicle trade by 8.2 per cent year-on-year.
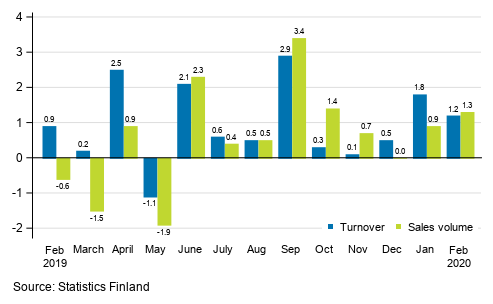
Annual change in working day adjusted turnover and sales volume in total trade (G), %
Working day adjusted turnover in retail trade rose by 3.5 per cent in February from February 2019. Sales volume grew by 3.3 per cent during the same period. Growth in retail trade was particularly attributable to specialised store trade, because working day adjusted turnover in that industry grew by 5.9 per cent and sales volume by 7.1 per cent. Turnover in department store trade rose by 5.2 per cent and sales volume by 4.2 per cent. In turn, turnover in daily consumer goods trade increased by 2.6 per cent and sales volume by 0.6 per cent year-on-year. The great differences in working day adjusted turnover and sales volume in daily consumer goods trade are explained by risen prices and correspondingly, in specialised store trade by fallen prices.
Annual change in working day adjusted turnover and sales volume in industries of trade, February 2020, % (TOL 2008)
Turnover and sales volume weaker than in the previous month
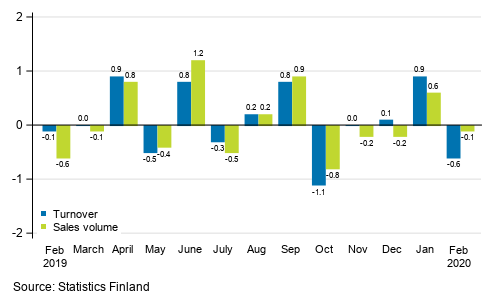
Seasonally adjusted turnover in total trade fell by 0.6 per cent in February compared to January. Over the same period, the volume of sales fell by 0.1 per cent. In turn, turnover and sales volume both rose in January from the previous month.
Change in seasonally adjusted turnover and sales volume in total trade (G) from the previous month, %
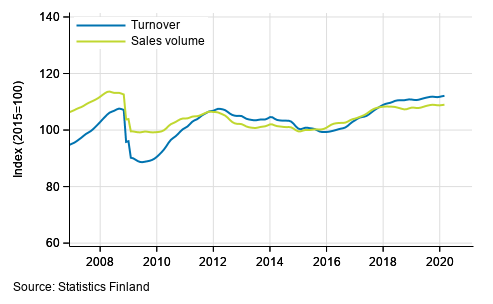
Trend of turnover and sales volume in total trade
The calculation of indices of turnover of trade is based on the Tax Administration’s data on self-assessed taxes, which are supplemented with Statistics Finland’s sales inquiry. The volume index of sales is calculated by removing the effect of price changes from the value index series.
The factors caused by the variation in the number of weekdays are taken into account in adjustment for working days. This means taking into consideration the lengths of months, different weekdays and holidays. In addition, seasonal variation is eliminated from seasonally adjusted series, on account of which it makes sense to compare observations of two successive months as well.
The data for the latest month are preliminary and they may become significantly revised particularly on more detailed industry levels in coming months.
Source: Turnover of trade, Statistics Finland
Inquiries: Suvi Kiema 029 551 3509, Reetta-Maria Salokannel 029 551 3657, palvelut.suhdanne@stat.fi
Director in charge: Mari Yl�-Jarkko
Publication in pdf-format (288.8 kB)
- Tables
-
Tables in databases
Pick the data you need into tables, view the data as graphs, or download the data for your use.
Appendix tables
- Revisions in these statistics
-
- Revisions in these statistics (15.4.2020)
Updated 15.04.2020
Official Statistics of Finland (OSF):
Turnover of trade [e-publication].
ISSN=1799-0939. February 2020. Helsinki: Statistics Finland [referred: 20.7.2026].
Access method: http://stat.fi/til/klv/2020/02/klv_2020_02_2020-04-15_tie_002_en.html