Value of household production has grown slightly slower than GDP in recent years
According to the internationally agreed practice, unpaid household work or services produced by households for themselves are not as a rule included in gross domestic product. However, it is possible to calculate a value for this work done by households. To calculate the value, there are two quite different methods: work can be priced either at market prices or as the sum of costs (work and products used in production). Pricing of household production at market prices would be a theoretically more correct method, but not enough information is found for it. The international guidelines published in 2017 recommend calculating the value of household production through costs, in other words, using the so-called input method. In Finland, the value of household production has been calculated using the input method since 2001 for the years when either of the main sources, the Time Use Survey or the Household Budget Survey were available. Previous calculations were made in collaboration between Statistics Finland and the National Consumer Research Centre, but in 2018 Statistics Finland took over full responsibility and will, in future, release the data annually. The first calculations compiled by Statistics Finland concerned 2016 and, at that time, the 2016 Household Budget Survey was available as a new data source. Now we release calculations concerning 2017 and 2018 based on annually available sources; no new data are available from the main sources, the Time Use Survey and the Household Budget Survey.
The 2017 and 2018 calculations of the statistics on the value of household production make use of the data of the Household Budget Survey of 2016, the Time Use Survey of 2009 and other annual statistics. The data of the 2009 Time Use Survey are updated with regard to the numbers of household types in 2017 and 2018, and time series revised annual levels of the national accounts have been used in calculating consumption data, which have been divided into types of households based on the 2016 Household Budget Survey. The figures concerning the value of household production were calculated according to the new international guidelines, whereby the time on household work by those aged 15 or over is taken into consideration in the calculations and voluntary work is not included in household production, but it is shown as a separate part.
When we talk about household production, it means household production both included in gross domestic product and excluded from gross domestic product. In the calculations, these two items are kept separate, whereby household production excluded from GDP can be taken as a proportion to GDP or it can be summed with GDP to calculate so-called extended GDP, and there is thus no overlapping in the calculations.
Calculated with the input method, the gross value added of household production covers the value of work done by households for themselves and consumption of fixed capital used in production, and it is the concept corresponding to gross domestic product in these calculations.
The calculations are compared with the figures of the national accounts of which time series revised data were published in September 2019. In the time series revision, the value of GDP increased by around EUR one to two billion annually starting from 2010, which is visible in the calculations of household production so that the ratio of household production to GDP decreased slightly. Time series revisions were also made to households’ consumption expenditure and the classification used changed somewhat. These revisions and changes have small effects on these calculations, as well as on consumer durables calculated as intermediate consumption and “investments” of household production and their “consumption”.
Gross value added of household production EUR 96.4 billion
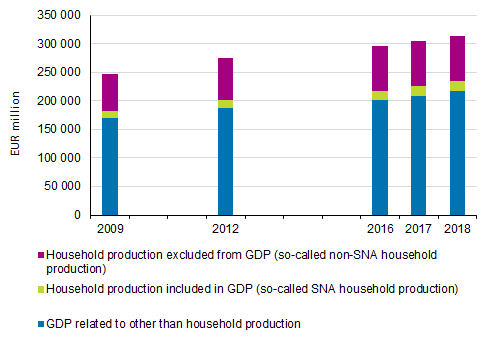
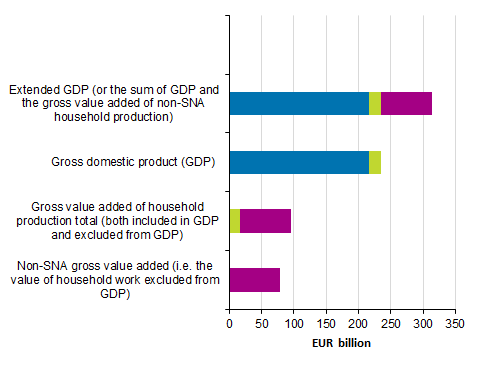
In 2018, gross domestic product was EUR 234.5 billion in Finland, and the gross value added of total household production EUR 96.4 billion. The share of household production in GDP was EUR 17.5 billion and the gross value added of household production excluded from GDP (so-called non-SNA) EUR 78.8 billion. The share of household production excluded from national accounts corresponded to 33.6 per cent of GDP. In 2009, 2012 and 2016, the gross value added of household production excluded from GDP as a ratio to GDP has been slightly higher.
Figure 1. Household production excluded from GDP as a ratio to GDP

The tables produced on Statistics Finland's Internet pages present earlier calculations according to the model designed in Finland for the years 2001 to 2012 and newer calculations compiled according to the international recommendations for the years 2009, 2012 and 2016 to 2018.
The so-called extended GDP, or the sum of GDP and the gross value added of household production excluded from GDP, was EUR 313.3 billion in 2018. The gross value added of household production – that is, we can now take into account both household production already included in GDP and excluded from GDP – is under one third of this extended GDP, that is, 30.8 per cent.
Figure 2. Extended GDP

Household production a wider concept
When we talk about household production, not only of the gross value added of household production, the concept includes both working time and the goods and services used in production. In national accounts, only acquisition of dwellings is calculated as households’ investments and other expenses are final consumption. When compiling the statistics on the value of household production, households’ consumption expenditure is grouped anew so that some of the products are calculated as intermediate products, some as investments and some directly as final consumption. Of these, final consumption is not included in household production.
In the model developed in Finland the time used on voluntary work is included in household production: the results of the Time Use Survey show that 75 per cent of the time used on voluntary work in 2009 was neighbourly help and 25 per cent was used on associations. In the international model voluntary work is not included in household production, but it is recommended that it is calculated and shown separately in the results.
Table 1: Value of household production in Finland in 2018
| Value of household production in 2018 / Households total / EUR million | Household production (SNA + non-SNA) Total | Voluntary work non-SNA | Household production incl. voluntary work Total |
| Value added, net | 85 632 | 7 518 | 93 150 |
| Consumption of capital | 10 758 | 0 | 10 758 |
| Value added, gross | 96 390 | 7 518 | 103 907 |
| Intermediate consumption | 34 303 | 0 | 34 303 |
| Value of output | 130 693 | 7 518 | 138 210 |
The statistics on the value of household production supplement the core system of national accounts in describing the significance of household production not included in national accounts. The statistics describe the monetary value of the goods and services produced by households for their own use.
Source: Value of household production, Statistics Finland
Inquiries: Katri Soinne 029 551 2778, kansantalous@stat.fi
Director in charge: Ville Vertanen
Updated 7.11.2019
Statistics:
Value of household production [e-publication].
ISSN=2490-0192. 2018,
Value of household production has grown slightly slower than GDP in recent years
. Helsinki: Statistics Finland [referred: 19.2.2026].
Access method: http://stat.fi/til/kotsa/2018/kotsa_2018_2019-11-07_kat_001_en.html

