Published: 11 November 2021
Value of household production grew – some effects of the coronavirus period will be visible in calculations only later
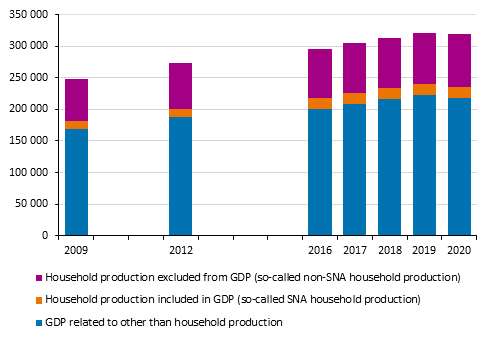
The gross value added of household production was EUR 102.1 billion in Finland in 2020 (change EUR +2.6 billion compared with the previous year). Over the same period, gross domestic product stood at EUR 236.2 billion (change EUR -3.9 billion from the previous year).
The changes caused by the first corona year are partly visible in the household production calculations. For example, the amount of money spent on restaurant services decreased and the amount of money spent on food grew when more food was cooked at home. By contrast, the growth in the time used for cooking is not yet visible in these figures, because data from the 2009 Time Use Survey are in use. The new Time Use Survey has just ended and its results will be available for household production calculations in autumn 2023.
The 2020 calculations of the statistics on the value of household production make use of the data of the Household Budget Survey 2016, the Time Use Survey 2009 and several other annual statistics. The data of the 2009 Time Use Survey are updated with regard to the numbers of household types in 2020, and the latest annual national accounts data have been used in the calculation of consumption data, which are divided by household type based on the 2016 Household Budget Survey. Changes in time use during the first corona year are not yet visible in these figures. In the 2020 calculations, the growth in the gross value added of household production is formed, on the one hand, from the change in hourly wages used in the calculation and, on the other hand, from changes in the numbers of household types.
According to the internationally agreed practice, unpaid household work or services produced by households for themselves are not as a rule included in gross domestic product. However, it is possible to calculate a value for this work done by households. The gross value added of household production covers the value of work done by households for themselves and consumption of fixed capital used in production, and it is the concept corresponding to gross domestic product in these calculations. When we talk about household production, not only of the gross value added of household production, the concept includes both working time and the goods and services used in production, such as foodstuffs used in food preparation. The figures concerning the value of household production are calculated according to international guidelines. According to these calculations, the value of household production grew by EUR +3.7 billion from 2019 to 2020, being EUR 140.0 billion in total.
Household production covers household production both included in gross domestic product and excluded from gross domestic product. In the calculations, these two items are kept separate, whereby the gross value added of household production excluded from GDP can be taken as a proportion to GDP or it can be summed with GDP to calculate so-called extended GDP.
In 2020, gross domestic product was EUR 236.2 billion in Finland, and the gross value added of total household production EUR 102.1 billion. The share of household production in GDP was EUR 18.5 billion and the gross value added of household production excluded from GDP (so-called non-SNA) was EUR 83.6 billion. The share of household production excluded from the national accounts corresponded to 35.4 per cent of GDP in 2020. From 2017 onwards, the ratio of gross value added of household production to GDP has fallen, until now in the first corona year, it rose slightly. In 2009, 2012 and 2016, the gross value added of household production excluded from GDP as a ratio to GDP was, on average, 36.3 per cent and in 2017 to 2019, on average, 34.1 per cent. While GDP fell and the gross value added of household production rose in 2020, the ratio grew by good one percentage point from the previous year.
The gross value added of household production excluded from GDP as a ratio to GDP.

The so-called extended GDP, or the sum of GDP and the gross value added of household production excluded from GDP, was EUR 319.8 billion in 2020. The gross value added of household production – that is, we can now take into account both household production already included in GDP and excluded from GDP – is close on one-third of this extended GDP, that is, 31.9 per cent. Extended GDP decreased from the previous year because the fall in GDP (EUR -4.3 billion) related to non-household production was larger than the growth in the gross value added of household production (EUR +2.6 billion).
The statistics on the value of household production supplement the core system of national accounts in describing the significance of household production not included in national accounts. The statistics describe the monetary value of the goods and services produced by households for their own use.
Statistics Finland's StatFin database contains calculations for 2009, 2012 and 2016 to 2020 compiled in accordance with the international recommendation both at the level of the whole economy and by type of household. Previous calculations according to the model compiled in Finland for the years 2001 to 2012 can be found in the archive.
Source: Value of household production, Statistics Finland
Inquiries: Katri Soinne 029 551 2778, kansantalous@stat.fi
Head of Department in charge: Katri Kaaja
Publication in pdf-format (167.6 kB)
- Tables
-
Tables in databases
Pick the data you need into tables, view the data as graphs, or download the data for your use.
Updated 11.11.2021
Statistics:
Value of household production [e-publication].
ISSN=2490-0192. 2020. Helsinki: Statistics Finland [referred: 23.2.2026].
Access method: http://stat.fi/til/kotsa/2020/kotsa_2020_2021-11-11_tie_001_en.html

