3. Infant mortality and maternal mortality
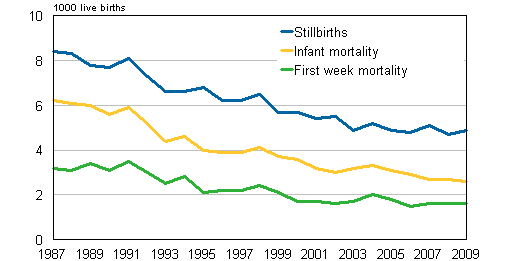
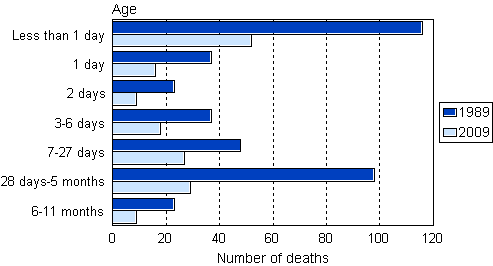
In 2009, 160 children died aged under one year, the figure being almost the same as the year before. Sixty per cent of children dying in their first year die during their first week of life and 76 per cent during the first four weeks of life. Perinatal mortality (deaths during the first week and stillborn) was 4.9 per thousand births. The figure has fallen by almost one half in the last decades. In 2009 there were 15 cot deaths. Cot deaths mostly occur to children over the age of one month.
Maternal mortality started to fall already in the 1970s, after which around one to seven mothers have died per year.
Figure 2. Stillborn and deaths at the age of under one year and under one week in 1987-2009

Figure 3. Deaths at the age of under one year by age in 1989 and 2009

Table 4. Causes of death among under one-year-olds in 2009
| Causes of death | Total | Less than 1 day | 1-6 days | 7-27 days | 28 days- 5 months |
6-11 months |
| TOTAL DEATHS | 160 | 52 | 43 | 27 | 29 | 9 |
| Perinatal causes | 74 | 30 | 31 | 10 | 3 | 0 |
| Congenital malformations | 52 | 18 | 10 | 13 | 10 | 1 |
| Sudden infant death syndrome | 15 | 0 | 0 | 2 | 8 | 5 |
| Diseases of circulatory system and respiratory system | 5 | 0 | 0 | 1 | 3 | 1 |
| Endocrine, nutritional and metabolic diseases | 5 | 0 | 1 | 1 | 2 | 1 |
| Other diseases | 4 | 0 | 1 | 0 | 2 | 1 |
| Assault | 4 | 4 | 0 | 0 | 0 | 0 |
| Accidents | 1 | 0 | 0 | 0 | 1 | 0 |
Table 5a. Leading causes of death among boys aged 1 to 14 in 1989 and 2009
| TOTAL DEATHS | Congenital malformations | Malignant neoplasms | Accidents | Endocrine, nutritional and metabolic diseases | Other diseases of the nervous system and sense organs | Assault | Suicides | |
| 1989 | 121 | 7 | 12 | 53 | 7 | 14 | 6 | 3 |
| 2009 | 42 | 10 | 9 | 7 | 4 | 2 | 1 | 0 |
Table 5b. Leading causes of death among girls aged 1 to 14 in 1989 and 2009
| TOTAL DEATHS | Malignant neoplasms | Congenital malformations | Endocrine, nutritional and metabolic diseases | Accidents | Other diseases of the nervous system and sense organs | Suicides | Assault | |
| 1989 | 76 | 12 | 12 | 3 | 28 | 4 | 0 | 2 |
| 2009 | 39 | 11 | 6 | 6 | 4 | 3 | 1 | 0 |
Table 6. Maternal mortality in 1960–2009
| Year | Maternal deaths per 100 000 live births |
Maternal deaths |
| 1960 | 71,8 | 59 |
| 1965 | 25,7 | 20 |
| 1970 | 12,4 | 8 |
| 1975 | 10,6 | 7 |
| 1980 | 1,6 | 1 |
| 1985 | 6,4 | 4 |
| 1990 | 6,1 | 4 |
| 1995 | 1,6 | 1 |
| 2000 | 5,3 | 3 |
| 2005 | 5,2 | 3 |
| 2006 | 6,8 | 4 |
| 2007 | 1,7 | 1 |
| 2008 | 8,4 | 5 |
| 2009 | 1,6 | 1 |
Source: Causes of death, Statistics Finland
Inquiries: Irmeli Penttilä (09) 1734 3253, Helena Korpi (09) 1734 3605, Ulla Arkkio (09) 1734 3757, kuolemansyyt@stat.fi
Director in charge: Jari Tarkoma
Updated 22.2.2011
Official Statistics of Finland (OSF):
Causes of death [e-publication].
ISSN=1799-5078. Annual review 2009,
3. Infant mortality and maternal mortality
. Helsinki: Statistics Finland [referred: 15.2.2026].
Access method: http://stat.fi/til/ksyyt/2009/01/ksyyt_2009_01_2011-02-22_kat_004_en.html

