

This set of statistics has been discontinued.
New data are no longer produced from the statistics.
Published: 8 February 2017
Municipalities’ loan stock in Mainland Finland was EUR 16.0 billion in 2016
According to financial statement estimate data, the loan stock of municipalities in Mainland Finland stood at EUR 16.0 billion at the end of 2016. The loan stock grew by EUR 0.5 billion or 3.4 per cent from the previous year. The growth was slower than in the year before when it was 5.6 per cent. These data appear from Statistics Finland's statistics on quarterly local government finances, for which financial statement estimate data concerning 2016 were collected from 297 municipalities and 138 joint municipal authorities in Mainland Finland.
Central government transfers, tax revenue, annual contribution margin and loan stock per capita of municipalities in Mainland Finland in 2006 to 2016*
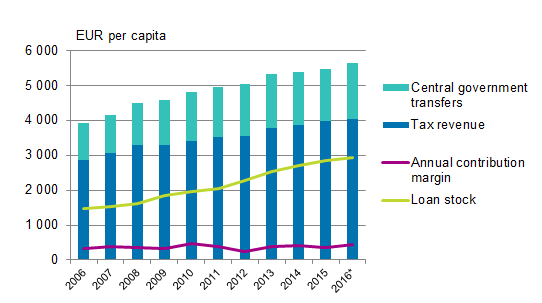
The population figures on 31 December for each year has been used as the population data for 2006 to 2015. The population figure on 31 December 2015 has been used in the estimate data for 2016.
*Financial statement estimates
Finances of municipalities and joint municipal authorities
According to the 2016 financial statement estimate data the combined operating margin of municipalities in Mainland Finland weakened by EUR 0.4 billion or 1.4 per cent from the year before.
Municipalities' tax funding, which consists of tax revenue and central government transfers to local government, grew by 3.0 per cent and amounted to EUR 30.7 billion. The share of tax revenue in the growth of tax funding was EUR 0.3 billion and that of central government transfers EUR 0.6 billion. The municipalities in Mainland Finland received EUR 4,025 in tax revenue per capita and EUR 1,608 in central government transfers.
The combined annual contribution margin of municipalities in Mainland Finland strengthened by 26.8 per cent from one year ago according to financial statement estimates and was EUR 2.4 billion. In 2016, altogether 18 municipalities estimated that their annual contribution margin will be negative while in the year before the annual contribution margin was negative for 13 municipalities according to verified data. In 2016, the annual contribution margin was EUR 440 per capita in Mainland Finland.
The loan stock of municipalities in Mainland Finland stood at EUR 16.0 billion at the end of 2016. The loan stock grew by EUR 0.5 billion or 3.4 per cent from the previous year. The growth was slower than in the year before when it was EUR 0.8 billion or 5.6 per cent. The loans of municipalities in Mainland Finland were EUR 2,938 per capita, having been EUR 2,841 in the year before. 1)
Based on estimates by the joint municipal authorities in Mainland Finland, their combined operating margin decreased from the previous year by EUR 48 million or 5.5 per cent. The annual contribution margin decreased in total by EUR 50 million or 6.4 per cent. The loan stock of joint municipal authorities stood at EUR 3.1 billion at the end of 2016, which was 3.5 per cent more than in the corresponding period of the previous year.
Information on the statistics
The statistics on quarterly local government finances are in the first to third quarters a sample survey that describes the development of the finances of municipalities and joint municipal authorities in Mainland Finland by quarter. For the statistical release on the fourth quarter, data are collected from all municipalities and joint municipal authorities in Mainland Finland.
The data in the statistics on quarterly local government finances are preliminary and they might become revised in coming publications. No quarterly data by municipality or joint municipal authority are published.
The data published in the statistics on quarterly local government finances are not directly comparable with the data of the statistics on local government finances by quarter because of the different way of handling local government enterprises. In the statistics on quarterly local government finances, local government enterprises are combined with the data on basic municipalities and joint municipal authorities, while this was not done in the statistics on local government finances by quarter published between 2013 and 2015.
1) The population data used were the population of Mainland Finland on 31 December 2015.
Source: Quarterly local government finances, 4th quarter 2016, Statistics Finland
Inquiries: Karen Asplund 029 551 3611, kuntatalous@stat.fi
Director in charge: Ville Vertanen
Publication in pdf-format (230.3 kB)
- Tables
-
Tables in databases
Pick the data you need into tables, view the data as graphs, or download the data for your use.
Appendix tables
- Appendix table 1. Financial statement estimate data (internal items eliminated) of municipalities and joint municipal authorities in Mainland Finland, EUR million 1) (8.2.2017)
- Appendix table 2. Quarterly data on the finances of municipalities and joint municipal authorities in Mainland Finland (incl. internal items), EUR million 1) (8.2.2017)
- Revisions in these statistics
-
- Revision of data (8.2.2017)
Updated 08.02.2017
Official Statistics of Finland (OSF):
Quarterly local government finances [e-publication].
ISSN=2343-4139. 4th quarter 2016. Helsinki: Statistics Finland [referred: 17.7.2026].
Access method: http://stat.fi/til/ktan/2016/04/ktan_2016_04_2017-02-08_tie_001_en.html