Published: 13 April 2012
Number of deaths decreased slightly from the year before
Corrected on 13 April 2012 at 11:40. The correction is indicated in red. Was previously lowest
In 2011, the number of deaths was 50,590, which is the second highest figure in eighteen years. The number of deaths was 300 lower in 2011 than in 2010. The number of deaths decreased by 200 among men and by 100 among women. Over the past ten years, women’s deaths numbered more than now in 2002 and 2010. If the war years are not taken into consideration, the number of men’s deaths was last higher than now in 1936.
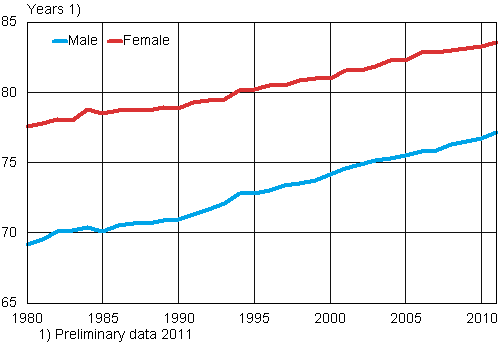
Life expectancy of male and female children at birth in 1980–2011

Life expectancy went up fractionally for both 0-year-old male and female children in 2011. The preliminary figure of the life expectancy of 0-year-olds was for men 77.2 and for women 83.5 years. The life expectancy of 0-year-olds indicates the number of years a person aged 0 would live provided the rate of mortality remains unchanged. The grown life expectancy of men and women at age 0 proves that the increase in the number of deaths from years 2005–2009 has been caused by grown numbers of aged men and women, and the ageing of the population, rather than by risen rate of mortality.
In 2011, the number of children having died during their first year of life was particularly low at 143. The infant mortality figure for 2011 was the second lowest during Finland’s independence. Infant mortality per 1,000 live births was 2.4.
Annual number of deaths in 2000–2011 by sex and deaths of 0-year-olds in 2000–2011
| Year | Total | Men | Women | 0-year-olds |
| 2000 | 49 339 | 24 053 | 25 286 | 213 |
| 2001 | 48 550 | 23 783 | 24 787 | 181 |
| 2002 | 49 418 | 23 992 | 25 426 | 168 |
| 2003 | 48 996 | 23 922 | 25 074 | 176 |
| 2004 | 47 600 | 23 802 | 23 798 | 191 |
| 2005 | 47 928 | 24 057 | 23 871 | 174 |
| 2006 | 48 065 | 24 315 | 23 750 | 167 |
| 2007 | 49 077 | 24 809 | 24 268 | 161 |
| 2008 | 49 094 | 24 457 | 24 637 | 157 |
| 2009 | 49 883 | 25 150 | 24 733 | 158 |
| 2010 | 50 887 | 25 539 | 25 348 | 140 |
| 2011 | 50 585 | 25 335 | 25 250 | 143 |
The highest number of deaths was recorded in March, whereas December has the highest number of deaths in the previous year. The second highest number of deaths occurred in January, which also had the second highest number of deaths in the previous year. In 2005–2008, March had the highest number of deaths.
Source: Population and Cause of Death Statistics. Statistics Finland
Inquiries: Matti Saari (09) 1734 3401
Director in charge: Jari Tarkoma
Publication in pdf-format (292.9 kB)
- Tables
-
Tables in databases
Pick the data you need into tables, view the data as graphs, or download the data for your use.
Appendix tables
- Appendix table 1. Deaths by month 2003 - 2011 (13.4.2012)
- Figures
- Quality descriptions
-
- Quality description, deaths 2011 (13.4.2012)
Updated 13.4.2012
Official Statistics of Finland (OSF):
Deaths [e-publication].
ISSN=1798-2545. 2011. Helsinki: Statistics Finland [referred: 9.2.2026].
Access method: http://stat.fi/til/kuol/2011/kuol_2011_2012-04-13_tie_001_en.html

