Published: 8 April 2014
Number of deaths at under one year decreased clearly from one year ago
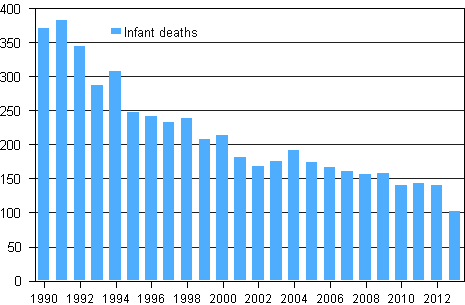
In 2013, the number of deaths of children during their first year of life decreased by 28 per cent. The number was by far the lowest during Finland's independence, amounting to 102 children. Twelve months previously the number was 141 children. Infant mortality per 1,000 live births was 1.8. Prior to 2013, the lowest infant mortality rate was 2.3 per mil in 2010.
Children having died during their first year of life in 1990–2013

Finland's infant mortality rate was, on average, the third lowest in 2009 to 2011 compared with Nordic countries and Western European countries (Appendix figure 4). Iceland and Sweden have a lower infant mortality rate than Finland, 1.63 and 2.37 per mil, respectively. Japan also has a low infant mortality rate, 2.3 per mil, according to Japan's Ministry of Health, Labour and Welfare.
The number of deaths in 2013 was 51,470, which is 250 fewer than in 2012. The number of deaths decreased by 250 for women and remained unchanged for men. The number of deaths has been higher only in 2012, in the war years and in the 1920s. Apart from 2012, the number of deaths among women was last higher than this 21 years ago. If the war years are not taken into consideration, the number of deaths among men was last higher than this in 1929.
In 2013, the average life expectancy at birth grew by 0.3 for men and by 0.4 for women. Life expectancy at birth indicates the number of years a person aged 0 would live provided the rate of mortality remains unchanged. The increased life expectancy at birth proves that despite the growing number of aged persons and the ageing of the population, mortality has decreased.
Annual number of deaths by sex and deaths of 0-year-olds in 2001–2013
| Year | Total | Men | Women | 0-year-olds total |
| 2001 | 48 550 | 23 783 | 24 787 | 181 |
| 2002 | 49 418 | 23 992 | 25 426 | 168 |
| 2003 | 48 996 | 23 922 | 25 074 | 176 |
| 2004 | 47 600 | 23 802 | 23 798 | 191 |
| 2005 | 47 928 | 24 057 | 23 871 | 174 |
| 2006 | 48 065 | 24 315 | 23 750 | 167 |
| 2007 | 49 077 | 24 809 | 24 268 | 161 |
| 2008 | 49 094 | 24 457 | 24 637 | 157 |
| 2009 | 49 883 | 25 150 | 24 733 | 158 |
| 2010 | 50 887 | 25 539 | 25 348 | 140 |
| 2011 | 50 585 | 25 335 | 25 250 | 143 |
| 2012 | 51 707 | 25 623 | 26 084 | 141 |
| 2013 | 51 472 | 25 631 | 25 841 | 102 |
Source: Population and Cause of Death Statistics. Statistics Finland
Inquiries: Matti Saari 09 1734 3401
Director in charge: Riitta Harala
Publication in pdf-format (275.7 kB)
- Tables
-
Tables in databases
Pick the data you need into tables, view the data as graphs, or download the data for your use.
Appendix tables
- Figures
-
- Appendix figure 1. Deaths by age group and sex 2013 (8.4.2014)
- Appendix figure 2. Life expectancy at birth by sex in 1980 - 2013 (8.4.2014)
- Appendix figure 3. Life expectancy of males and females at birth by region on average in years 2011 - 2013 (8.4.2014)
- Appendix figure 4. Mortality during first year of life in Nordic and Western European countries an average of 2009 - 2011 (8.4.2014)
- Quality descriptions
-
- Quality description, deaths 2013 (8.4.2014)
Updated 08.4.2014
Official Statistics of Finland (OSF):
Deaths [e-publication].
ISSN=1798-2545. 2013. Helsinki: Statistics Finland [referred: 15.2.2026].
Access method: http://stat.fi/til/kuol/2013/kuol_2013_2014-04-08_tie_001_en.html

