Published: 28 April 2017
Number of deaths increased from the previous year
Corrected on 10 May 2017 . The correction is indicated in red.
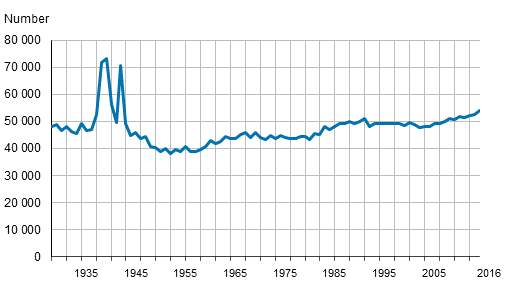
In 2016, a total of 53,923 persons died, which is the largest number since 1944. The previous record year after the 1940s was 2015, from which the number of deaths now grew by another 1,431. Altogether, 501 more women and 930 more men died than in 2015.
Deaths in 1930 to 2016

Most deaths occurred in January, December and March. January’s 5,336 deaths were the largest number of deaths in January since 1944. Last time more than 5,000 deaths occurred in one month was in December 2003.
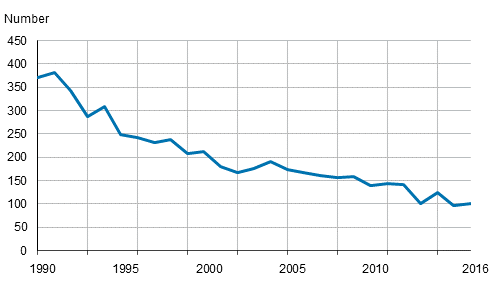
In 2016, a total of 100 children died during their first year. The number of children dying at the age of under one year, that is, infant mortality, was nearly the same as in 2015, when 97 children died. In 2016, infant mortality per one thousand live-born children was 1.9 which is 0.2 per mil points higher than in the previous year. Even though the number of infant deaths remained almost unchanged, infant mortality is higher due to a lower number of live births. In 2013 to 2015, Finland's average infant mortality was smallest compared with other Nordic and Western European countries.
Deaths at the age of under one year in 1990 to 2016

In 2016, the average life expectancy at birth was 78.4 years for boys and 84.1 years for girls. Men’s average life expectancy decreased by 0.1 years and women’s remained unchanged from 2015. Men’s average life expectancy has grown steadily since the 1980s, though there was a similar minor drop in 1995 from the year before. Life expectancy at birth indicates the number of years a person aged 0 would live provided the rate of mortality remains unchanged.
Annual number of deaths by sex and deaths of 0-year-olds in 2002 to 2016
| Year | Total | Men | Women | 0-year-olds total |
| 2002 | 49 418 | 23 992 | 25 426 | 168 |
| 2003 | 48 996 | 23 922 | 25 074 | 176 |
| 2004 | 47 600 | 23 802 | 23 798 | 191 |
| 2005 | 47 928 | 24 057 | 23 871 | 174 |
| 2006 | 48 065 | 24 315 | 23 750 | 167 |
| 2007 | 49 077 | 24 809 | 24 268 | 161 |
| 2008 | 49 094 | 24 457 | 24 637 | 157 |
| 2009 | 49 883 | 25 150 | 24 733 | 158 |
| 2010 | 50 887 | 25 539 | 25 348 | 140 |
| 2011 | 50 585 | 25 335 | 25 250 | 143 |
| 2012 | 51 707 | 25 623 | 26 084 | 141 |
| 2013 | 51 472 | 25 631 | 25 841 | 102 |
| 2014 | 52 186 | 25 748 | 26 438 | 124 |
| 2015 | 52 492 | 25 992 | 26 500 | 97 |
| 2016 | 53 923 | 26 922 | 27 001 | 100 |
Source: Deaths 2016. Statistics Finland
Inquiries: Katariina Heikkilä 029 551 3638, Matti Saari 029 551 3401, info@stat.fi
Director in charge: Jari Tarkoma
Publication in pdf-format (271.7 kB)
- Tables
-
Tables in databases
Pick the data you need into tables, view the data as graphs, or download the data for your use.
Appendix tables
- Figures
- Quality descriptions
-
- Quality description, deaths 2016 (28.4.2017)
Updated 28.4.2017
Official Statistics of Finland (OSF):
Deaths [e-publication].
ISSN=1798-2545. 2016. Helsinki: Statistics Finland [referred: 10.2.2026].
Access method: http://stat.fi/til/kuol/2016/kuol_2016_2017-04-28_tie_001_en.html

