Published: 27 April 2018
Men died on average 7 years younger than women
According to Statistics Finland, a total of 53,722 persons died in 2017, which is 201 fewer than in 2016. Men died, on average, 7.1 years younger than women while twenty years ago, the corresponding difference between average ages at death was 13.3 years. Average life expectancy at birth was 78.7 years for boys and 84.2 years for girls in 2017.
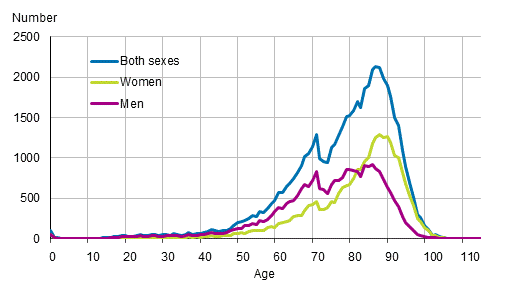
Age distribution at the time of death by sex in 2017

In 2017, men died, on average, at the age of 74.8 and women at 81.9. So, women died, on average, 7.1 years older than men. In young age groups, a majority of deaths occurred among young men but among persons aged 82 and older there were more women than men. The median age at death for men was 77.4 years and for women 85.4 years. The median describes the middle value, that is, one-half of all persons that died, died at a younger or older age than the median age at death.
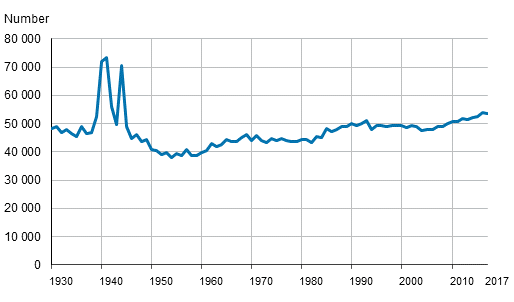
Altogether, 53,722 persons died in 2017, of which there were 68 men more than women. The total number was 201 lower than in 2016, when the number of deaths reached a record level since the 1940s. Most people died in January, 5,492 persons, which was the second highest monthly number of deaths since 1944.
Deaths in 1930 to 2017

In 2017, the average life expectancy at birth was 78.7 years for boys and 84.2 years for girls. For boys, the life expectancy increased by 0.3 years and for girls by 0.1 years compared with 2016. Life expectancy at birth indicates the number of years a person aged 0 would live provided the rate of mortality remains unchanged.
The number of children dying at the age of under one year was 102, which is at the same level as in the two previous years. In 2017, the number of infant deaths per one thousand live-born children was 2.0, which is 0.1 per mil units higher than in the previous year. Even though the number of infant deaths remained almost unchanged, infant mortality rate is slightly higher than the two previous years due to a lower number of births.
Annual number of deaths by sex and deaths of 0-year-olds in 2007 to 2017
| Year | Total | Men | Women | 0-year-olds total |
| 2007 | 49 077 | 24 809 | 24 268 | 161 |
| 2008 | 49 094 | 24 457 | 24 637 | 157 |
| 2009 | 49 883 | 25 150 | 24 733 | 158 |
| 2010 | 50 887 | 25 539 | 25 348 | 140 |
| 2011 | 50 585 | 25 335 | 25 250 | 143 |
| 2012 | 51 707 | 25 623 | 26 084 | 141 |
| 2013 | 51 472 | 25 631 | 25 841 | 102 |
| 2014 | 52 186 | 25 748 | 26 438 | 124 |
| 2015 | 52 492 | 25 992 | 26 500 | 97 |
| 2016 | 53 923 | 26 922 | 27 001 | 100 |
| 2017 | 53 722 | 26 895 | 26 827 | 102 |
Source: Deaths 2017. Statistics Finland
Inquiries: Katariina Heikkilä 029 551 3638, info@stat.fi
Director in charge: Jari Tarkoma
Publication in pdf-format (257.5 kB)
- Tables
-
Tables in databases
Pick the data you need into tables, view the data as graphs, or download the data for your use.
- Figures
- Quality descriptions
-
- Quality description, deaths 2017 (27.4.2018)
Updated 27.4.2018
Official Statistics of Finland (OSF):
Deaths [e-publication].
ISSN=1798-2545. 2017. Helsinki: Statistics Finland [referred: 12.2.2026].
Access method: http://stat.fi/til/kuol/2017/kuol_2017_2018-04-27_tie_001_en.html

