Votes cast for the parties and voting turnout in the Municipal elections 2004
Election victory for the Social Democratic Party and the National Coalition Party, the Centre Party lost some of its support
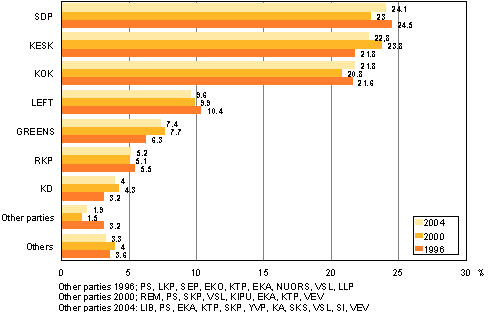
The Social Democratic Party emerged as the winner of the Municipal elections, thus becoming the biggest party of the country. The Social Democrats gained 24.1 per cent of all votes cast, growing the proportion of votes cast for the party by 1.1 percentage points. The Social Democratic Party renewed its victory in the Municipal elections for the 12th time since the 1953 elections. With a total of 575,433 votes cast, the Social Democrats defeated the party with the next best result, the Centre Party, by over 32,000 votes. The SDP increased its support in nearly all constituencies, most in Helsinki, by 3.1 percentage points. Of the constituencies, only in North Karelia and Lapland the numbers of votes cast for the SDP were slightly lower than in 2000. In the whole country the Social Democratic Party gained 2,587 council seats, of which women received 1,026, or 39.6 per cent.
The Centre Party of Finland received the second highest number of votes in the country, and lost its position as the largest party from the previous Municipal elections. It gained 22.8 per cent of the votes cast and lost its support by one percentage point compared with the previous Municipal elections. The total number of votes cast for the Centre Party, 543,495, rose higher than in the previous elections, however. It now gathered over 15,000 more votes than in 2000. Examined by constituency, the number of votes cast for the party was slightly lower in all other constituencies but in the constituencies of Central Finland (+ 1.0), Uusimaa (+ 0.6) and Helsinki (+ 0.8 percentage points). The Centre Party gained a total of 4,422 seats, of which women got 1,489, i.e. 33.7 per cent.
The number of votes cast for the National Coalition Party made up 21.8 per cent of all votes. The party was the second winner of the elections, raising its proportion of votes cast by one percentage point. The total number of votes cast for the Coalition Party was 520,959, over 57 000 votes more than in the previous elections. The Coalition Party lost its support in Helsinki, by 0.7 percentage points and in the municipalities of the Central Finland constituency, by 0.3 percentage points. In the areas of other constituencies the Coalition Party won or kept its position. In all, the Coalition Party gained 2,076 council seats in the whole country, of which women got 730, or 35.1 per cent.
The Left Alliance gained 9.6 per cent of all votes cast. Its relative support fell by 0.3 percentage points. The number of votes cast for the party increased by over 8,000 from the previous Municipal elections. The Left Alliance gained 989 seats in the whole country, of which women got 334, i.e. 33.8 per cent.
The number of votes cast for the Green League fell by 0.4 percentage points to 7.4 per cent and the Greens gained 313 council seats in the whole country.
Among the smaller parties, the number of votes cast increased for the Swedish People's Party in Finland by 0.1 percentage points (636 councillors), for True Finns by 0.2 percentage points and for the Communist Party of Finland by 0.1 percentage points. The number of votes cast for the Christian Democrats in Finland fell by 0.3 percentage points to four per cent of all votes cast. The party gained 392 seats in the whole country. Among the Swedish People's Party's elected councillors women accounted for 37.8 per cent, among Green councillors for 62.3 per cent, and among Christian Democrat councillors for 44.8 per cent.
Of the total number of councillors (11,966), 36.3 per cent were women, which is around two percentage points more than in the previous Municipal elections.
Proportion of votes cast for the parties in the Municipal elections in 2004, 2000 and 1996 (%)

Council seats for major parties in the Municipal elections 1968 - 2004, number and %
| Year | KESK | SDP | KOK | LEFT | ||||
| No. | % | No. | % | No. | % | No. | % | |
| 1968 | 3 533 | 29.8 | 2 351 | 19.8 | 1 388 | 11.7 | 1 770 | 14.9 |
| 1972 | 3 297 | 29.5 | 2 533 | 22.6 | 1 503 | 13.4 | 1 691 | 15.1 |
| 1976 | 3 936 | 30.9 | 2 735 | 21.5 | 2 047 | 16.1 | 2 050 | 16.1 |
| 1980 | 3 889 | 30.4 | 2 820 | 22.1 | 2 373 | 18.6 | 1 835 | 14.4 |
| 1984 | 4 052 | 31.5 | 2 830 | 22.0 | 2 423 | 18.8 | 1 482 | 11.5 |
| 1988 | 4 227 | 32.9 | 2 866 | 22.3 | 2 392 | 18.6 | 1 336 | 10.4 |
| 1992 | 3 998 | 31.8 | 3 130 | 24.9 | 2 009 | 16.0 | 1 319 | 10.5 |
| 1996 | 4 453 | 35.7 | 2 733 | 21.9 | 2 172 | 17.4 | 1 130 | 9.1 |
| 2000 | 4 625 | 37.7 | 2 559 | 20.8 | 2 028 | 16.5 | 1 027 | 8.4 |
| 2004 | 4 422 | 37.0 | 2 587 | 21.7 | 2 076 | 17.3 | 989 | 8.3 |
Voting turnout rose by 2.7 percentage points from the previous elections
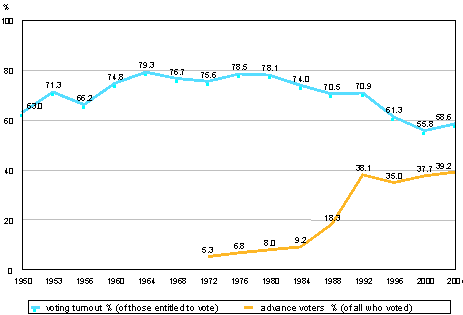
Voting turnout was now higher than four years previously. Voting turnout was 58.6 per cent, while it 55.9 per cent in 2000. Although voting turnout was higher than in the previous elections, it remained the second lowest of all times since the 1950 Municipal elections. The number of advance voters also grew in these elections by around 100,000. In all, 39.2 per cent of all those who voted cast their votes in advance. Voting was as a whole weaker in urban municipalities (56.3%) than in semi-urban (60.7%) and rural municipalities (63.8%). Of all constituencies, voting turnout was highest in Vaasa, 65.6 per cent, and in Satakunta, 61.2 per cent. The same constituencies also held the top positions in the previous Municipal elections. Voting turnout was lowest in the constituency of North Karelia, 55.3 per cent.
The total number of persons entitled to vote was 4,099,864. The right to vote was the same in these as in the previous Municipal elections. Those entitled to vote were those citizens of Finland or another EU Member State, Iceland and Norway who had reached the age of 18 not later than on the election day, and whose municipality of domicile, as intended in the Act on the Municipality of Domicile, is the municipality in question in the Population Information System. Further, entitled to vote were also those foreigners fulfilling the same criteria who had been living continuously in Finland for at least two years. In all, around 75,000 foreigners were entitled to vote, of whom 29,000 were citizens of some other EU Member States.
Voting turnout in the Municipal elections in 1950 - 2004, %

Source: Election Statistics. Statistics Finland
Further information: Eeva Heinonen +358 9 1734 3268, vaalit.tilastokeskus@stat.fi
Last updated 25.10.2004
Contact InformationElection statistics
Telephone (09) 1734 1
E-mail: vaalit.tilastokeskus@tilastokeskus.fi
Statistics:
(none) [e-publication].
(none),
Votes cast for the parties and voting turnout in the Municipal elections 2004
. Helsinki: (none) [referred: 22.2.2026].
Access method: http://stat.fi/til/kvaa/2004/kvaa_2004_2004-10-25_kat_002_en.html
