

Published: 15 December 2014
Current account slightly in surplus in the third quarter, goods imports declining
Corrected on 7 January 2015 . The corrections are indicated in red.
The current account showed slight surplus in the third quarter of 2014. Positive capital outflow.
Current account
The current account was EUR 0.1 billion in surplus in the third quarter of 2014. The current account remained on the same level as in the third quarter of 2013. Of the sub-items of the current account, the trade account in balance of payment terms rose by EUR 0.7 billion from the third quarter of 2013 to EUR 0.2 billion. The increase was caused by a decrease in the value of goods imports in balance of payment terms in the third quarter. Throughout the ongoing year, major changes cannot, however, be detected in the levels of imports and exports compared to 2013. The services account was almost in balance and did not change from the third quarter of 2013.
The primary income account was EUR 0.1 billion in surplus. The surplus of the primary income account decreased by EUR 0.8 billion from the third quarter of 2013 due to an increase in investment income paid abroad. Investment income consists of the inward and outward payments of interests, dividends and reinvested earnings. Investment income to Finland amounted to EUR 3.1 billion and to EUR 3.0 billion from Finland. The secondary income account was EUR 0.2 billion in deficit. The secondary income account includes payments to international organisations.
Financial account and international investment position
In the third quarter of 2014, outward capital flow on net from Finland amounted to EUR 0.5 billion. Outward capital flow was mainly in the form of portfolio investments, altogether EUR 3.7 billion. Inward capital flow was EUR 1.9 billion as direct investments.
At the end of September 2014, Finland had EUR 711.3 billion in foreign assets and EUR 701.8 billion in foreign liabilities. Finland's net international investment position grew slightly in the third quarter to EUR 9.5 billion. Exchange rate changes increased the net international investment position by EUR 2.5 billion, while other valuation changes decreased it by EUR 1.8 billion. Other valuation changes include price changes.
At the end of September, the biggest foreign assets (EUR 292.2 billion) and liabilities (EUR 361.7 billion) were those of deposit banks. The wealth of social security funds and the indebtedness of the non-financial corporations sector continued in the third quarter. During the third quarter, foreign assets of social security funds grew by EUR 4.2 billion, while non-financial corporations imported a total of EUR 3.5 billion in capital on net. The net international investment position of the central government sector weakened by EUR 2.2 billion during the third quarter.
Securities
In the third quarter of 2014, foreign investors dissolved EUR 0.9 billion worth of investments in shares and mutual fund shares and EUR 1.7 billion of investments in debt securities. At the end of September 2014, outward portfolio investment liabilities stood at EUR 282.3 billion, of which EUR 87.2 billion were investments in shares and mutual fund shares, and EUR 195.1 billion (were) investments in debt securities. In the third quarter, portfolio investment liabilities increased by EUR 4.1 billion from the previous quarter even though investments were dissolved. Value changes in securities increased liabilities by EUR 4.2 billion and exchange rate changes by EUR 2.6 billion.
Outward portfolio investment amounted to EUR 1.1 billion in the third quarter. A total of EUR 0.8 billion in foreign investments in shares and mutual fund shares were dissolved and EUR 2.0 billion were invested in debt securities. Debt security investments mainly consisted of investments in long-term bonds (EUR 1.7 billion). At the end of September 2014, outward portfolio investment assets stood at EUR 279.8 billion, of which EUR 135.3 billion were investments in shares and mutual fund shares, and EUR 144.5 billion were investments in debt securities. In the third quarter, portfolio investment assets amounted to EUR 7.7 billion of which the share of value changes in securities was EUR 1.3 billion and that of exchange rate changes was EUR 5.4 billion.
Direct investments
At the end of September 2014, direct investment assets on gross stood at EUR 139.4 billion and the corresponding liabilities at EUR 107.2 billion. During the third quarter, direct investment assets increased by EUR 1.4 billion and liabilities by EUR 2.6 billion.
Finland still has clearly more direct investment assets than liabilities even though the net investment position related to these investments has weakened clearly during 2014. At the end of 2013, assets exceeded liabilities by EUR 43.7 billion but at the end of September 2014, the difference was only EUR 32.2 billion. The change in the net investment position is mainly explained by changes in intra-group loans and trade credits. During January to September, these debt assets decreased by EUR 3.5 billion and the corresponding liabilities increased by EUR 7.3 billion.
Other investments
In the third quarter of 2014, other investments, i.e. loans, deposits and trade credits amounted to EUR 0.4 billion inward on net. At the end of the quarter, assets as other investments amounted to EUR 172.0 billion and liabilities to EUR 209.3 billion. The net investment position related to these investments weakened by EUR 2.1 billion in the third quarter and exchange rate changes accounted for EUR 1.6 billion of the drop.
Finland’s balance of payments in October 2014
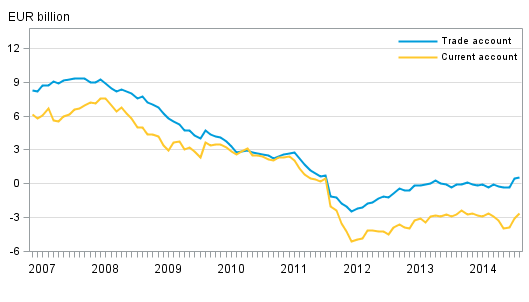
The current account was EUR 0.5 billion in surplus in October. One year earlier, the current account showed a deficit of EUR 0.1 billion. The 12-month moving total of the current account was EUR 2.6 billion in deficit.
Finland’s current account and trade account, 12 moving sum
In October, outward capital flow on net from Finland amounted to EUR 0.9 billion. Direct investment was EUR 0.3 million outward on net and portfolio investment was EUR 0.9 billion outward on net, while other investment was EUR 0.3 billion inward on net.
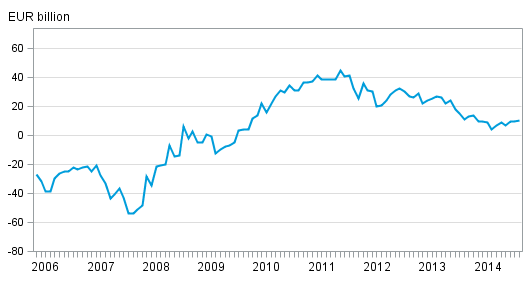
At the end of October 2014, the international net investment position stood at EUR 10.3 billion. Finns had EUR 710 billion in foreign assets and EUR 700 billion in foreign liabilities.
Finland’s monthly international investment position
Source: Balance of payments and international investment position, Statistics Finland
Inquiries: Mira Malhotra 029 551 3411, Tapio Kuusisto 029 551 3318, balanceofpayments@stat.fi.
Director in charge: Leena Storg�rds
Publication in pdf-format (337.3 kB)
- Tables
-
Tables in databases
Pick the data you need into tables, view the data as graphs, or download the data for your use.
Appendix tables
- Appendix table 1. Finland's current account, quarterly 2014, EUR million (15.12.2014)
- Appendix table 2. External assets and liabilities by sector, quarterly 2014, EUR million (15.12.2014)
- Appendix table 3. International investment position by sector, quarterly 2014, EUR million (15.12.2014)
- Appendix table 4. Finland's balance of payments 2014, EUR million (15.12.2014)
- Figures
Updated 15.12.2014
Official Statistics of Finland (OSF):
Balance of payments and international investment position [e-publication].
ISSN=2342-348X. October 2014. Helsinki: Statistics Finland [referred: 26.7.2026].
Access method: http://stat.fi/til/mata/2014/10/mata_2014_10_2014-12-15_tie_001_en.html