Published: 15 September 2015
Current account in deficit in the second quarter, net capital outflow from Finland
Current account deficit in the second quarter of 2015 diminished from one year ago. In July, the current account showed a surplus. On the financial account side, capital was exported from Finland in the second quarter. These data derive from Statistics Finland's balance of payments and international investment position statistics.
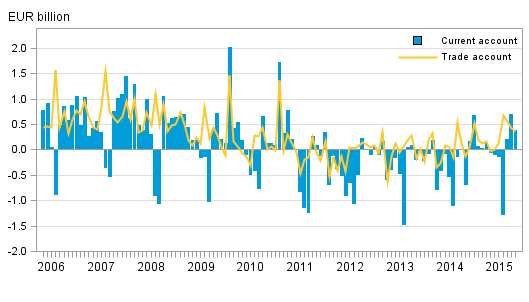
Finland’s current account and trade account

Current account in the second quarter
The current account was EUR 0.4 billion in deficit in the second quarter of 2015. The deficit was generated from the service, primary and secondary income accounts. The value of exports of goods decreased from one year ago but the bigger drop in imports than in exports pushed the goods account clearly into surplus.
The value of goods exports was EUR 14.3 billion in the second quarter. As in the first quarter, goods exports to Russia and Sweden continued to decline in the second quarter while goods exports to Germany grew.
The value of goods imports in balance of payment terms was EUR 12.7 billion in the second quarter and decreased by 12 per cent compared to the second quarter of 2014. The value of goods imports from Russia declined by 49 per cent. The goods account was EUR 1.7 billion in surplus as the value of goods imports declined more than the value of exports.
Service exports amounted to EUR 5.2 billion in the second quarter. The telecommunications, computer, and information services item and business activities grew from the corresponding quarter of the previous year. Service exports were depressed by the decrease in consumption by Russian visitors in Finland. Foreign tourists' consumption in Finland amounted to EUR 0.5 billion in the second quarter. Finns’ travel abroad continued growing and the travel account was EUR 0.6 billion in deficit. Overall, service imports, EUR 5.8 billion, remained on last year's level. The service account, derived from the difference between service exports and imports was EUR 0.6 billion in deficit.
The primary income account was EUR 0.9 billion in deficit. The deficit was generated from investment income, which amounted to EUR 4.4 billion from abroad to Finland and to EUR 5.4 billion to abroad from Finland. Both investment income paid from abroad to Finland and to abroad from Finland grew from the second quarter in 2014. The secondary income account was EUR 0.6 billion in deficit. The secondary income account includes such as payments to international organisations.
Current account in July 2015
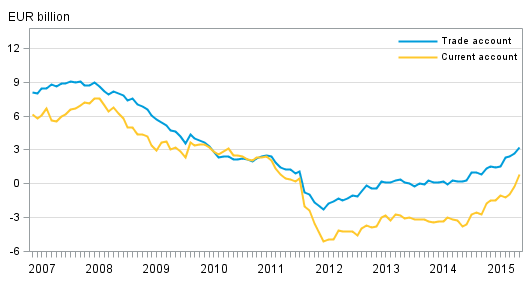
In July, the current account was EUR 0.4 billion in surplus. The current account surplus was generated from the goods and primary income accounts. The 12-month moving total of the current account was EUR 0.8 billion in surplus.
Finland’s current account and trade account, 12 –month moving sum

Financial account and international investment position
In the second quarter of 2015, net capital outflow from Finland amounted to EUR 4.6 billion. Capital outflow was mainly in the form of other investments (loans, deposits and trade credits), totalling EUR 11.3 billion. The main source of capital inflow was direct investments, EUR 3.9 billion.
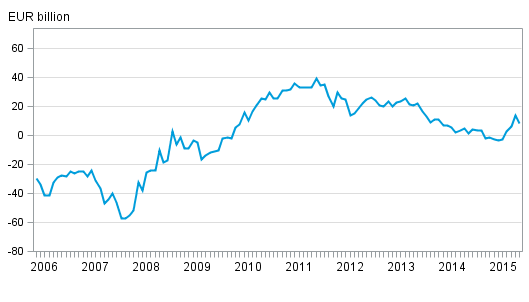
At the end of June 2015, Finland had EUR 754.4 billion in foreign assets and EUR 740.6 billion in foreign liabilities. Finland's net international investment position grew in the second quarter to EUR 13.9 billion. The net investment position turned positive after two negative quarters. Price changes related to foreign assets and liabilities boosted the net investment position by EUR 10.8 billion in the second quarter. Changes in exchange rates and other valuation changes also strengthened the net investment position by EUR 1.0 billion.
Table 1. External assets and liabilities by investment type in 2015 Q2, EUR billion
| Opening positiion 31.03.2015 | Financial transactions 2015 Q2 | Price changes 2015 Q2 | Changes in the exchange rates and valuation adjustments 2015 Q2 | Closing position 30.6.2015 | |
| Financial account | -2,5 | 4,6 | 10,8 | 1,0 | 13,9 |
| Assets | 798,8 | -11,7 | -28,1 | -4,6 | 754,4 |
| Liabilities | 801,3 | -16,3 | -38.9 | -5,5 | 740,6 |
| Direct investment | 14,3 | -3,9 | -0,1 | 3,0 | 13,3 |
| Assets | 131,6 | 1,6 | -0,4 | 0,0 | 132,8 |
| Liabilities | 117,3 | 5,4 | -0,3 | -3,0 | 119,5 |
| Portfolio investment | 2,4 | -0,2 | 11,0 | -2,2 | 11,0 |
| Assets | 306,7 | -1,4 | -2,3 | -3,6 | 299,5 |
| Liabilities | 304,3 | -1,2 | -13,3 | -1,4 | 288,4 |
| Other investment | -37,4 | 11,3 | 0,0 | 0,3 | -25,8 |
| Assets | 197,0 | 9,7 | 0,0 | -0,7 | 206,0 |
| Liabilities | 234,4 | -1,6 | 0,0 | -1,1 | 231,7 |
| Financial derivatives | 8,6 | -2,8 | 0,0 | 0,0 | 5,9 |
| Reserve assets | 9,6 | 0,1 | -0,1 | -0,2 | 9,5 |
Direct investments
At the end of June 2015 direct investment assets on gross stood at EUR 132.8 billion and the corresponding liabilities at EUR 119.5 billion. During the second quarter, direct investment assets increased by EUR 1.2 billion and liabilities by EUR 2.2 billion.
Finland still has more direct investment assets than liabilities even though the net investment position related to these investments has weakened further during 2015. At the end of 2014, assets exceeded liabilities by EUR 19.3 billion but at the end of June 2015, the difference was only EUR 13.3 billion. The change in the net investment position is mainly explained by changes in intra-group loans and trade credits. During the first half of 2015, these debt assets decreased by EUR 0.7 billion and the corresponding liabilities increased by EUR 10.7 billion.
Portfolio Investments
At the end of June 2015, Finland's portfolio investment assets stood at EUR 299.5 billion, of which EUR 148.4 billion were investments in equity and mutual fund shares, and EUR 151.1 billion in bonds and money market instruments. In the second quarter of 2015, EUR 2.2 billion in foreign investments in equity and mutual fund shares were dissolved and EUR 0.9 billion were added to debt securities. In the second quarter, portfolio investment assets decreased by a total of EUR 7.2 billion. The share of price changes in the fall of the investment stock was EUR 2.3 billion and that of other valuation changes EUR 3.6 billion.
At the end of June 2015, Finland's portfolio investment liabilities stood at EUR 288.4 billion, of which EUR 96.1 billion were investments in equity and mutual fund shares, and EUR 192.4 billion in bonds and money market instruments. In April to June, foreign investors lowered their investments in equity and mutual fund shares by EUR 1.4 billion and increased their investments in debt securities by EUR 0.2 billion. In the second quarter, portfolio investment liabilities decreased by a total of EUR 15.9 billion. Changes in security prices decreased liabilities by EUR 13.3 billion and other valuation changes by EUR 1.4 billion.
Other investments
In the second quarter of 2015, net capital outflow of other investments, i.e. loans, deposits and trade credits amounted to EUR 11.3 billion. The net investment position related to other investments improved by EUR 11.6 billion in the second quarter when the share of value changes, EUR 0.3 billion, is considered. At the end of the second quarter, assets as other investments amounted to EUR 206.0 billion and liabilities to EUR 231.7 billion. Of these assets, EUR 172.3 billion and of the liabilities, EUR 196.7 billion were held by financial institutions.
Financial derivatives
At the end of June, Finland had net assets in financial derivatives 5.9 billion EUR, which is EUR 2.8 billion less than at the end of March. Both assets and liabilities decreased clearly in the second quarter as a result of price and value changes.
July 2015
In July, Finland's foreign financial assets and liabilities decreased. Due to a slightly bigger decline in financial assets, net capital inflow to Finland amounted to EUR 1.2 billion. The main source of capital inflow was other investments, EUR 3.0 billion. Direct investment inflow was EUR 0.4 billion and portfolio investment outflow was EUR 2.7 billion.
Finland's net investment position was EUR 8.5 billion positive at the end of July, as foreign assets amounted to EUR 744.7 billion and foreign liabilities to EUR 736.2 billion. Finland's net international investment position decreased by EUR 5.3 billion compared with the end of June, which was mainly caused by a decline in other investment assets.
The data for August 2015 will be published on 15 October 2015.
Finland’s international investment position monthly

Source: Balance of payments and international investment position, Statistics Finland
Inquiries: Mira Malhotra 029 551 3411, Tapio Kuusisto 029 551 3318, balanceofpayments@stat.fi.
Director in charge: Ville Vertanen
Publication in pdf-format (302.0 kB)
- Tables
-
Tables in databases
Pick the data you need into tables, view the data as graphs, or download the data for your use.
Appendix tables
- Appendix table 1. Finland's current account, quarterly 2015, EUR million (15.9.2015)
- Appendix table 2. External assets and liabilities by sector, quarterly 2015, EUR million (15.9.2015)
- Appendix table 3. International investment position by sector, quarterly 2015, EUR million (15.9.2015)
- Appendix table 4. Finland's balance of payments 2015, EUR million (15.9.2015)
Updated 15.9. 2015
Official Statistics of Finland (OSF):
Balance of payments and international investment position [e-publication].
ISSN=2342-348X. July 2015. Helsinki: Statistics Finland [referred: 10.2.2026].
Access method: http://stat.fi/til/mata/2015/07/mata_2015_07_2015-09-15_tie_001_en.html

