Published: 15 March 2021
Current account in surplus in the fourth quarter, net international investment position strengthened
The current account was in surplus in the fourth quarter of 2020. The value of goods exports in balance of payments terms decreased by 3 per cent from twelve months back. In turn, the value of goods imports decreased by 8 per cent. At the same time, the value of service exports decreased by 10 per cent year-on-year, while the value of service imports declined by 20 per cent. The primary income account was in surplus. Compared to the previous quarter, the net international investment position strengthened. The data appear from Statistics Finland's statistics on balance of payments and international investment position.
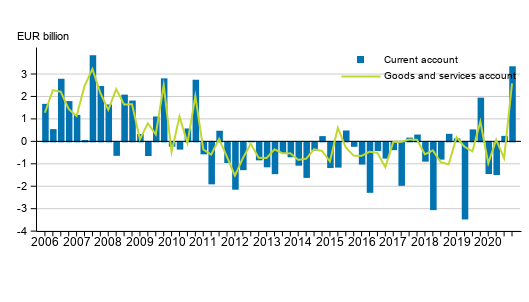
Current account and goods and services account

Current account
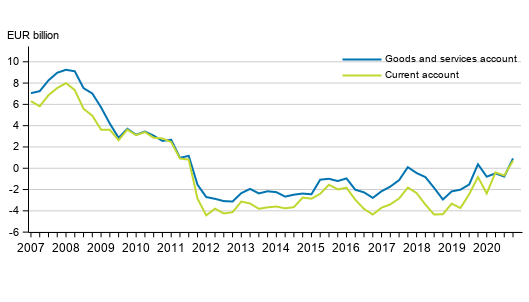
In the fourth quarter of 2020, the current account was EUR 3.3 billion in surplus. The four-quarter moving total of the current account was EUR 0.7 billion in surplus. The balance of goods and services was EUR 2.6 billion in surplus. Of the sub-items of the current account, the primary income account was EUR 1.3 billion in surplus and the secondary income account was EUR 0.5 billion in deficit.
Goods and services
The goods account in balance of payments terms was EUR 2.3 billion in surplus in the fourth quarter. In the corresponding quarter of the previous year, the goods account was EUR 1.5 billion in surplus. The services account showed a surplus of EUR 0.3 billion in the fourth quarter of 2020.
The value of goods exports in balance of payment terms decreased by three per cent year-on-year and was EUR 16.7 billion while the value of goods imports in balance of payment terms decreased by eight per cent year-on-year to EUR 14.4 billion. The value of service exports declined by 10 per cent year-on-year and totalled EUR 7.3 billion. The value of service imports, in turn, decreased by 20 per cent year-on-year to EUR 7.0 billion.
More detailed import and export figures in balance of payments terms by service item and area can be found in the statistics on international trade in goods and services starting from 2013. Decreases and increases made to the Finnish Customs figures, which result in goods trade in balance of payments terms, are also broken down in the statistics on international trade in goods and services.
Primary income
The primary income account was EUR 1.3 billion in surplus in the fourth quarter of 2020. The primary income account includes compensation of employees, investment income and other primary income paid abroad from Finland and from abroad to Finland. The surplus of primary income was mainly due to investment income, which includes such as returns on capital like interests, dividends and reinvested earnings.
In the last quarter of 2020, property income paid to Finland on net amounted to EUR 1.2 billion, while property income paid to Finland from abroad amounted to EUR 4.4 billion and property income paid abroad from Finland to EUR 3.3 billion. Most property income on net from abroad to Finland was paid in the form of direct investments, EUR 1.1 billion in the last quarter.
Finland’s current account and goods and services account, 12 –month moving sum

Financial account and net international investment position
Portfolio investments strengthened the net international investment position
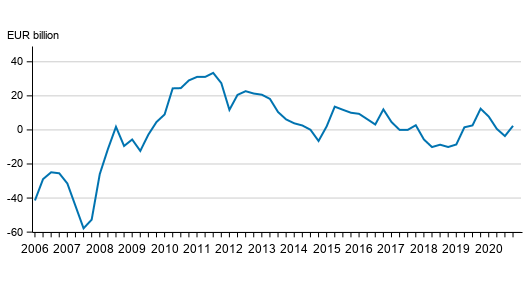
In the last quarter of 2020, Finland had EUR 831.6 billion in foreign assets on gross and EUR 829.2 billion in foreign liabilities on gross. The net international investment position, that is, the difference between the stock of assets and liabilities, was thus EUR 2.4 billion as there were more assets than liabilities. Gross assets diminished mainly due to the fallen stocks of other investments. Gross liabilities also diminished due to the fallen stocks of other investments.
The net international investment position strengthened from the previous quarter when the net international investment position was EUR -3.6 billion. Financial transactions stood for EUR 1.5 billion of the rise in the net international investment position, while prices and exchange rates and other changes in classifications stood for EUR 4.5 billion.
Portfolio investment assets and liabilities grew
Examined by type of investment, there were most foreign assets in the form of portfolio investments at the end of the last quarter of 2020. Portfolio investment assets grew from the previous quarter. At the end of the last quarter of 2020, there were EUR 356.1 billion in portfolio investment assets, while in the previous quarter there were EUR 338.3 billion in assets. The change in stocks is almost entirely explained by changes in the prices of portfolio investments. Of portfolio investment assets, EUR 128.0 billion were in bonds and money market instruments and EUR 228.1 billion in equity and mutual fund shares.
The share of portfolio investments is also highest in foreign liabilities. At the end of the last quarter of 2020, portfolio investment liabilities stood at EUR 431.2 billion and, as a result of price changes, the stock of portfolio investment liabilities also grew significantly from the previous quarter, when the stock of portfolio investment liabilities stood at EUR 419.3 billion. Portfolio investment liabilities were highest in the form of bonds and money market instruments, which stood at EUR 266.1 billion at the end of the fourth quarter.
Finland’s net international investment position quarterly

When examining the net international investment position by type of investment, it can be seen that the biggest net assets were in direct investments, while the largest net liabilities were in the form of portfolio investments. At the end of the last quarter of 2020, net assets in direct investments were EUR 56.3 billion and net liabilities in portfolio investments EUR 75.1 billion. The large net liability of portfolio investments is explained by the net liabilities of EUR 138.1 billion in bonds and money market instruments. Assets in equity and mutual fund shares were EUR 63.0 billion larger than liabilities.
Capital flowed abroad on net from Finland
In the last quarter of 2020, net capital outflow from Finland abroad amounted to EUR 1.5 billion. Net capital outflow from Finland was mostly in the form of direct investments, EUR 1.8 billion. In the form of other investments, net capital outflow from Finland abroad amounted to EUR 0.3 billion.
Social security funds had largest net assets
When the net investment position is examined by investor sector, most foreign net assets, EUR 160.2 billion, were held by social security funds, of which employment pension schemes are the most important ones. EUR 131.7 billion of social security funds’ net assets were in the form of equity and mutual fund shares and EUR 25.0 billion in the form of money market instruments and bonds. The net assets of social security funds grew from the previous quarter primarily as a result of price changes in assets of equity and mutual fund shares. Net liabilities were held most by other monetary financial institutions, EUR 120.6 billion. The net investment position of monetary financial institutions strengthened from the third quarter of 2020 due to a decrease in the net liability of other investments.
Source: Balance of payments and international investment position, Statistics Finland
Inquiries: Hanna Björklund 029 551 3296, Johannes Nykänen 029 551 3641, balanceofpayments@stat.fi.
Head of Department in charge: Katri Kaaja
Publication in pdf-format (332.3 kB)
- Tables
-
Tables in databases
Pick the data you need into tables, view the data as graphs, or download the data for your use.
Appendix tables
- Appendix table 1. Current account, quarterly 2020, EUR million (15.3.2021)
- Appendix table 2. External assets and liabilities by sector, quarterly 2020, EUR million (15.3.2021)
- Appendix table 3. International investment position by sector, quarterly 2020, EUR million (15.3.2021)
- Appendix table 4. Balance of payments, EUR million (15.3.2021)
Updated 15.3.2021
Official Statistics of Finland (OSF):
Balance of payments and international investment position [e-publication].
ISSN=2342-348X. 4th quarter 2020. Helsinki: Statistics Finland [referred: 15.2.2026].
Access method: http://stat.fi/til/mata/2020/44/mata_2020_44_2021-03-15_tie_001_en.html

