Published: 29 April 2011
Immigration lower than one year before
According to Statistics Finland, 25,650 persons immigrated to Finland from foreign countries during 2010. The number is 1,050 lower than one year before. Emigration from Finland also decreased slightly and was 11,900 persons. During 2010, net immigration totalled 13,750 persons, which is 800 down on the year before. Net immigration by foreign citizens contracted very little, or by 150 persons.
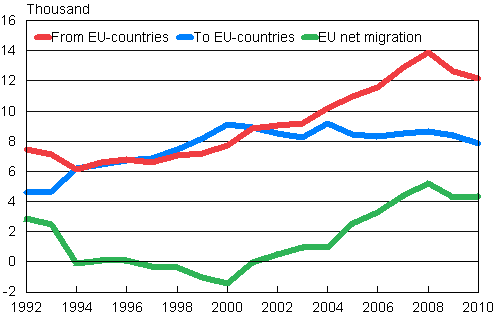
Migration between Finland and other EU countries 1992–2010

Last year, 12,200 persons immigrated to Finland from the EU countries. Immigration from the EU countries was 450 persons down on the year before. Emigration from Finland to the EU countries contracted by 500 persons. The figure on emigration from Finland to the EU countries was the lowest in twelve years. In 2010, Finland had a migration gain of 4,350 persons from the EU countries. Finland’s migration gain from the EU countries was fractionally up on the previous year.
In 2010, intermunicipal migrations numbered 270,688, which is 7,050 more than in 2009. The number of migrations between regions was 121,950 and increased by 4,400. Migrations inside regions increased by 2,650. When looking at migration inside the country, the region of Uusimaa had the largest migration gain (1,900 persons) and the region of Pirkanmaa the second largest (1,600 persons). Relative to population, migration gain was the highest (0.3%) in Kanta-Häme and Pirkanmaa. The highest numbers of population were lost in migration inside the country by the regions of Lapland (950) and Kainuu (600). Kainuu suffered the largest migration loss relative to population (0.7%) and Lapland the second largest (0.5%). During 2010, intramunicipal migrations numbered 558,997, which is 2,600 (0.5%) down on 2009. Kainuu and Lapland suffered the largest migration losses relative to the size of the population.
Migration 2000–2010
| Year | Type | ||||
| Intermunicipal | Intramunicipal migration | Immigration | Emigration | Net migration | |
| 2000 | 243,034 | 544,690 | 16,895 | 14,311 | 2,584 |
| 2001 | 263,989 | 594,609 | 18,955 | 13,153 | 5,802 |
| 2002 | 256,382 | 577,888 | 18,113 | 12,891 | 5,222 |
| 2003 | 255,502 | 593,589 | 17,838 | 12,083 | 5,755 |
| 2004 | 265,157 | 599,494 | 20,333 | 13,656 | 6,677 |
| 2005 | 274,642 | 614,507 | 21,355 | 12,369 | 8,986 |
| 2006 | 272,280 | 593,286 | 22,451 | 12,107 | 10,344 |
| 2007 | 278,907 | 589,363 | 26,029 | 12,443 | 13,586 |
| 2008 | 268,524 | 547,973 | 29,114 | 13,657 | 15,457 |
| 2009 | 263,646 | 571,617 | 26,699 | 12,151 | 14,548 |
| 2010 | 270,688 | 568,997 | 25,636 | 11,905 | 13,731 |
- The regional division in all years is the one valid on 1 January 2011.
Source: Population and Cause of Death Statistics. Statistics Finland
Inquiries: Matti Saari (09) 1734 3401, vaesto.tilasto@stat.fi
Director in charge: Jari Tarkoma
Publication in pdf-format (277.7 kB)
- Tables
-
Tables in databases
Pick the data you need into tables, view the data as graphs, or download the data for your use.
Appendix tables
- Figures
- Quality descriptions
-
- Quality description, migration 2010 (29.4.2011)
Updated 29.4.2011
Official Statistics of Finland (OSF):
Migration [e-publication].
ISSN=1797-6782. 2010. Helsinki: Statistics Finland [referred: 10.2.2026].
Access method: http://stat.fi/til/muutl/2010/muutl_2010_2011-04-29_tie_001_en.html

