Published: 20 December 2021
Net immigration by Finnish citizens turned positive in 2020
Net immigration by Finnish citizens has been negative in the 2010s. In 2016 to 2019, migration loss has clearly decreased, however, and in 2020 net immigration turned into a gain of 1,109 persons. The development of net immigration by Finnish citizens has been rising in all educational groups. Net immigration was positive for those with basic level education and those with higher tertiary education or doctorate level education last year, while in other educational groups emigration exceeded immigration marginally.
Net immigration of Finnish adult citizens by level of education in 2005 to 2020
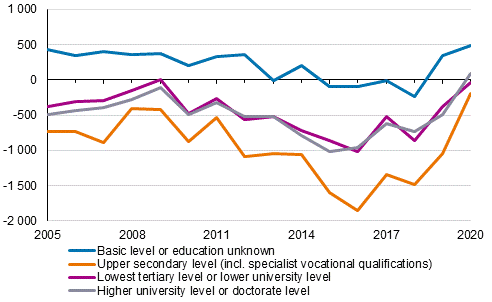
According to Statistics Finland's data on population changes, the net immigration of Finnish citizens was 1,109 moves positive in 2020. Altogether more than 8,500 Finnish citizens moved abroad from Finland and over 9,600 Finnish citizens moved to Finland. During the past decade, net immigration by Finnish citizens was lowest in 2016, when the number of emigrations by Finnish citizens was good 4,000 higher than that of immigrations. From 2016 to 2020, immigration among Finnish citizens has grown steadily, in total by 26 per cent, and emigration has decreased by 27 per cent.
The net immigration loss among adult Finnish citizens has decreased in all educational groups in recent years. In 2016, there were around 1,000 more emigrations than immigrations in the groups with lowest tertiary education or lower tertiary education and at least higher tertiary education, but by 2020, the loss had diminished in both educational groups and for those with at least higher tertiary education net immigration was marginally positive (94 persons). Among completers of upper secondary education, migration loss was nearly 1,800 in 2016, but has since decreased most, to just under 200 in 2020. The net immigration of persons with basic level education or unknown education became positive already in 2019.
The immigration of adult Finnish citizens has increased in all educational groups during 2016 to 2020. The growth has been biggest for those with higher tertiary or doctorate level education, 38 per cent. Among those with lowest tertiary or lower tertiary degrees, immigration increased by 25 per cent and among those with upper secondary qualifications by 34 per cent during 2016 to 2020.
Emigration decreased more than one-fifth in all educational groups in 2016 to 2020. The drop was biggest for those with at least higher tertiary education, 30 per cent, and those with lowest tertiary or lower tertiary education, 28 per cent.
Finland's migration gain also from persons with Finnish background in 2020
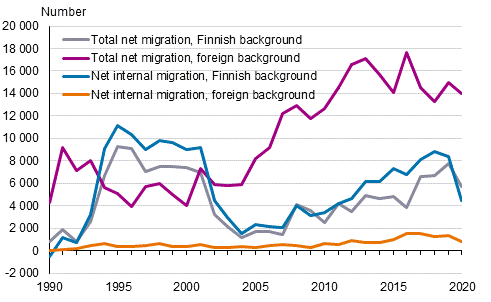
Finland's net immigration has been positive for a long time. In the 2010s, the number of immigrations has yearly been around 12,000 to 17,000 higher than the number of emigrations. Examined by origin, migration gain has in the past decade been formed almost entirely or entirely from persons with foreign background. However, in 2020 net immigration by persons with Finnish background also turned positive, by 1,795 persons. Net immigration by persons with foreign background was around 16,000 persons positive in 2020.
The largest background country group in immigration of persons with foreign background was the former Soviet Union (2,475 immigrations). The next largest immigrant groups were people of Iraqi background (1,355), of Estonian background (1,352), of Indian background (1,011) and of Chinese background (909). Net immigration was highest in the background country group of the former Soviet Union (1,698), those with Iraqi background (1,132) and those with Russian background (686).
Net immigration by origin in 1990 to 2020
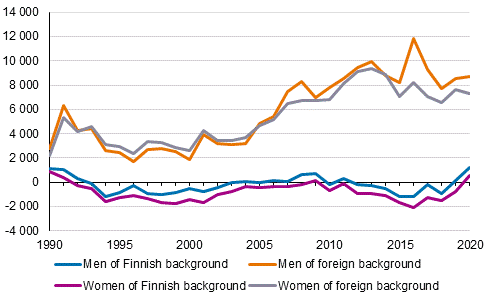
For women with Finnish background net immigration has been slightly negative for just under three decades. The loss has been around 100 to 2,100 moves annually. In individual years, net immigration by men with Finnish background has been marginally positive, but during 2012 to 2018, for example, the number of emigrations exceeded the number of immigrations by some 200 to 1,100 persons annually. In 2020, net immigration of women with Finnish background turned positive by 556 persons and that of men with Finnish background was also positive, by 1,239 persons.
The net immigration of men and women with foreign background has fluctuated since the late 1990s, but after 2012, the growth in migration gain has slowed down somewhat for men with foreign background and slightly decreased for women with foreign background. In 2020, net immigration was nearly 7,300 persons for women and good 8,700 for men.
More information about immigration and emigration by origin can be found on the thematic pages on Immigration and integration .
Record number of intermunicipal migrations
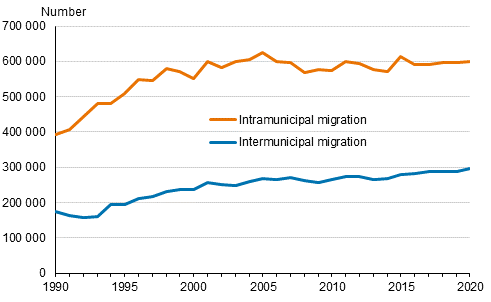
Intermunicipal migration has been growing steadily since the 1990s. By 2020, the number of intermunicipal migrations has risen to nearly 300,000. In 2020, the number was highest in measuring history, nearly 297,000 migrations. The numbers of intramunicipal migrations have been relatively permanent since the beginning of the 2000s. During that period, the number of migrations has been around 570,000 to 620,000 per year. In 2020, intramunicipal migrations numbered around 600,000.
Internal migration within Finland in 1990 to 2020
Out-migration propensity from urban municipalities increased
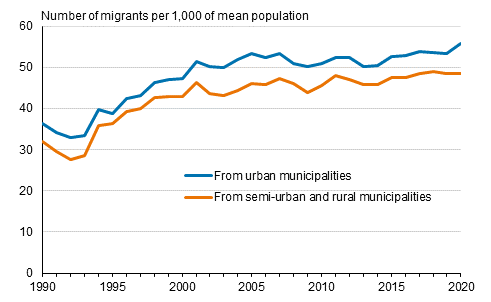
Relative to the population, intermunicipal migration has also been brisk and growing in the long term. However, the growth has evened out slightly since 2000. Typical for the period has been a slightly rising trend fluctuating according to economic cycles. In 2020, the number of moves increased relative to previous years, being around 53.7 moves per one thousand persons. Examined by municipality group, it can be seen that migration propensity from urban municipalities has been slightly higher than that from semi-urban and rural municipalities and that the difference grew in 2020 due to a large growth in migration propensity from urban municipalities.
Out-migration propensity in Finland in urban, semi-urban and rural municipalities in 1990 to 2020
Most of the internal migration is migration between urban areas
An increasing share of intermunicipal migrations is migration between urban areas. In 2020, altogether 65 per cent of intermunicipal migrations were migrations from urban areas to urban areas. Fifteen per cent of intermunicipal migrations were migrations from urban areas to rural areas, 13 per cent from rural areas to urban areas, and seven per cent from rural areas to rural areas.
Of moves to urban areas, four-fifths also originated from urban areas and one-fifth from rural areas. Two-thirds of the moves to rural areas originated from urban areas and one-third from rural areas.
Total net migration of urban municipalities mainly net immigration
The total migration gain of urban municipalities has been sustained by the high immigration of persons with foreign background relative to emigration. For persons with Finnish background, emigration has in turn been higher than immigration in urban municipalities, which has in part lowered the overall migration gain of urban municipalities.
Total net migration of urban municipalities and net migration by persons’ background country in 1990 to 2020
Net migration to urban municipalities decreased in several age groups
Among age groups, the biggest cause for migration gain in urban areas is student-age persons (aged 15 to 24). Their net migration has remained fairly stable for the past 16 years, being around 11,000 persons per year. Examined by age group, the growth in the migration gain of towns in the past few decades has been mostly caused by the growth in net migration in other age groups.
Changes in net migration have been relatively significant among young children and working-age adults, even though the number of moves has been lower than among students. Among the 25 to 44 and 0 to 4 and 5 to 14 age groups, migration loss to urban municipalities has decreased relatively evenly since 2011 until year 2019.
In 2020, net migration decreased clearly compared with the two previous years, especially among those aged 25 to 44. In 2020, migration loss in urban municipalities was 3,700 persons for those aged 25 to 44 and 980 persons for those aged 0 to 4, and 1,070 persons for those aged 45 to 64.
Net migration in urban municipalities in the 0 to 4, 5 to 14, 25 to 44 and 45 to 64 age groups in Finland in 1990 to 2020

Source: Migration 2020. Statistics Finland
Inquiries: Juhana Nordberg 029 551 3051, Joni Rantakari 029 551 3249, Markus Rapo 029 551 3238, info@stat.fi
Head of Department in charge: Hannele Orjala
Publication in pdf-format (273.7 kB)
- Tables
-
Tables in databases
Pick the data you need into tables, view the data as graphs, or download the data for your use.
- Quality descriptions
-
- Quality description, migration 2020 (20.12.2021)
Updated 20.12.2021
Official Statistics of Finland (OSF):
Migration [e-publication].
ISSN=1797-6782. 02 2020. Helsinki: Statistics Finland [referred: 21.2.2026].
Access method: http://stat.fi/til/muutl/2020/02/muutl_2020_02_2021-12-20_tie_001_en.html

