Published: 17 March 2022
Completion within the target period of upper secondary education weakened and that of tertiary education improved in 2020
According to Statistics Finland's education statistics, completion of upper secondary education slowed down in 2020. Of those having started studies, 60 per cent completed vocational education in three-and-a-half years and 79 per cent completed general upper secondary education. The pass rate of university of applied sciences degrees within the target period remained on level with the previous year (57%). At universities, completion of master’s degrees within the target period improved by four percentage points, rising to a pass rate of 34 per cent.
Pass rates sector of education, %
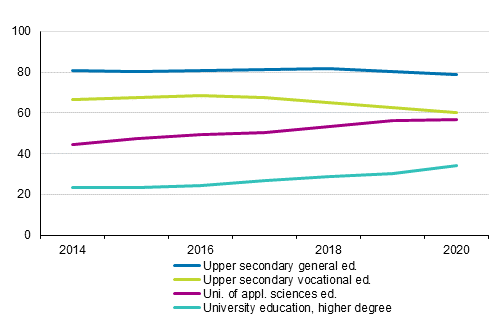
The pass rate indicates how many per cent of those that started the education have completed the education within the examined study time. The target period for general upper secondary education and vocational education is 3.5 years, for university of applied sciences education 4.5 years and for higher university degrees 5.5 years.
Pass rates for upper secondary general education by gender in different reference periods in 2020
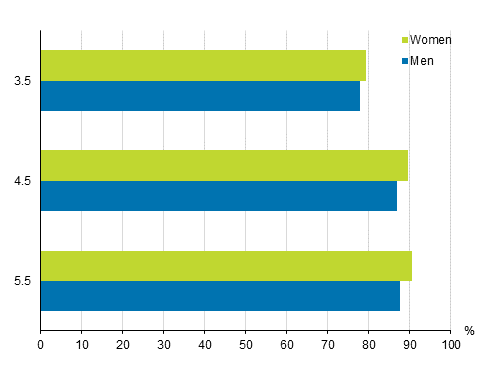
The coronavirus year had a negative impact on the completion of upper secondary education. In 2020, the pass rate of those having started general upper secondary education weakened by one percentage point from the previous year. In general upper secondary education (those having started in 2017), 79 per cent passed the matriculation examination in at most three-and-a-half years. Among men, 78 per cent completed the matriculation examination within the target period and among women 79 per cent. Fourteen per cent continued their general upper secondary studies and four per cent had switched to some other education. After 4.5 years of starting general upper secondary school studies (those having started in 2016), 89 per cent had completed the matriculation examination, 87 per cent of men and 90 per cent of women.
Pass rates for initial vocational education by gender in different reference period in 2020
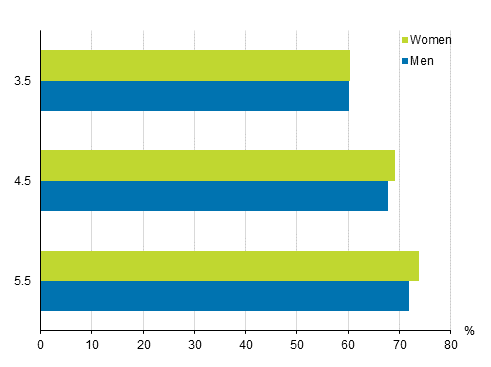
The pass rate for those having started initial vocational qualifications weakened by 2.5 percentage points from the year before. Sixty per cent completed initial vocational qualifications within the target time (those having started in 2017), as many men as women. Discontinuation of vocational education also increased in 2020, see Discontinuation of education .
During the reference period, the pass rate of initial vocational education was at its highest in 2016, when 68 per cent of the students having started the education completed it within the target period. The pass rate of initial vocational education within the target period has fallen for the past four statistical years in a row.
The pass rate increases as the study time lengthens. Four-and-a-half years after starting initial vocational qualifications (those having started in 2016), 68 per cent had completed them, and 5.5 years after (those having started in 2015), 73 per cent had completed them.
Pass rates for university of applied sciences education by gender in different reference periods in 2020
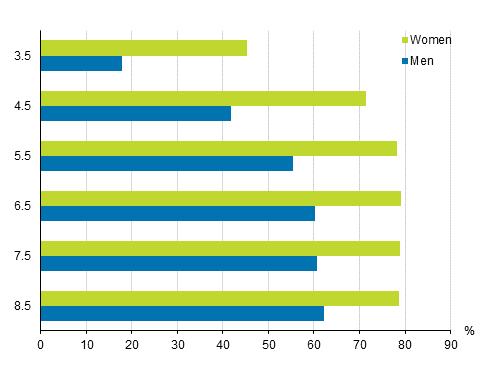
Within the target time (4.5 years), 57 per cent of those having started university of applied sciences education passed their studies, 42 per cent of men and 71 per cent of women. The pass rate was highest in the field of health and welfare, 76 per cent, and lowest in the field of technology, 38 per cent. Of those who started studying in the field of technology in 2016 and had not completed the qualifications they had started, two per cent had completed some other qualification, 42 per cent still studied at a university of applied sciences and eight per cent were working full-time.
Sixty-seven per cent of those having started studies completed a university of applied sciences degree in five-and-a-half years. The pass rate for men grew to 55 per cent and that of women to 78 per cent. Sixty-two per cent of men and 79 per cent of women completed their studies in eight-and-a-half years. After eight years, nine per cent of the men who had not completed their university of applied sciences degree had completed some other qualification, five per cent continued their university of applied sciences studies and 13 per cent were working full-time. Correspondingly, eight per cent of women had completed some other qualification, two per cent continued their university of applied sciences studies and five per cent worked full-time.
Pass rates for higher university degree by gender in different reference periods in 2020
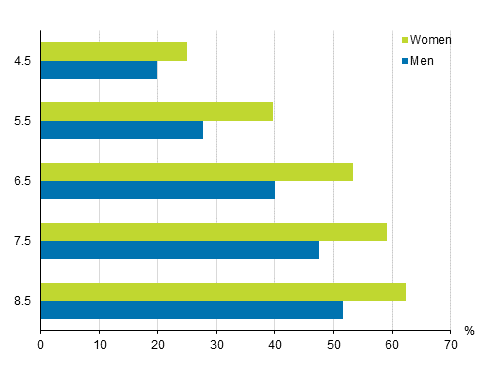
In 2020, more students than before passed university education than in the previous year. The pass rate of master’s degrees within the target time (5.5 years) improved by four percentage points. Thirty-four per cent of those having started their studies passed within that time, 28 per cent of men and 40 per cent of women. The weaker employment situation of students in 2020 may also have had an impact on the acceleration of the pass rate, see Employment of students . The pass rate was highest in the field of education, 48 per cent, and lowest in the field of natural sciences, 22 per cent.
The older the cohort of new students is examined, the higher the pass rate became: 58 per cent of those who started university studies had completed a master’s degree in eight-and-a-half years, 52 per cent of men and 62 per cent of women. Twenty per cent had completed a bachelor’s degree.
The database tables of these statistics have been renewed and comparison data between different cohorts in different target periods are easier to obtain from them than before. The database tables also contain data by region of education and field of education, as well as on the main type of activity in different years of students who did not pass their education.
Source: Education Statistics, Statistics Finland
Inquiries: Anna Loukkola 029 551 3678, koulutustilastot@stat.fi
Head of Department in charge: Hannele Orjala
Publication in pdf-format (180.8 kB)
- Tables
-
Tables in databases
Pick the data you need into tables, view the data as graphs, or download the data for your use.
Updated 17.3.2022
Official Statistics of Finland (OSF):
Progress of studies [e-publication].
ISSN=1799-1021. 2020. Helsinki: Statistics Finland [referred: 19.2.2026].
Access method: http://stat.fi/til/opku/2020/opku_2020_2022-03-17_tie_001_en.html

