Published: 9 October 2020
Turnover of employment activities continued to grow in 2019
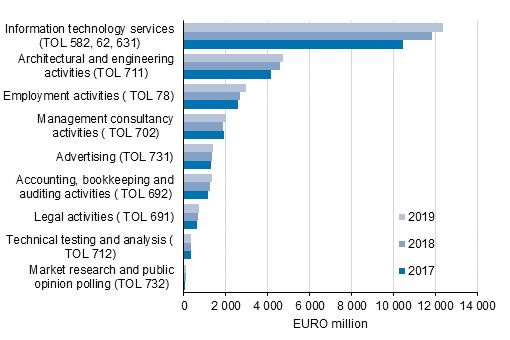
According to Statistics Finland's business services statistics, employment activities grew most among service industries, its turnover growing by over nine per cent in 2019. Compared with the previous year, turnover also grew in management consultancy activities, legal activities, information technology services, and accounting, bookkeeping and auditing activities. By contrast, the turnover of market research and public opinion polling and technical testing and analysis was declining.
Figure 1. Development of the turnover of business services in selected industries in 2017 to 2019

Temporary employment agency services for the supply of manufacturing workers still the biggest service item in employment activities; temporary employment agency services for the supply of hotel and restaurant personnel grew strongly in 2019
The majority, or 86 per cent, of the turnover of services in employment activities consisted of sales of temporary employment agency services. Activities of employment placement agencies and other human resources provision covered 14 per cent of the turnover of employment activities.
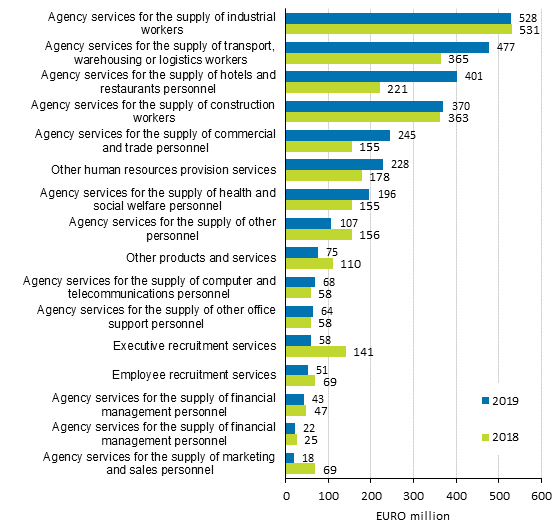
Among the service items of employment activities, turnover in temporary employment agency services for the supply of hotel and restaurant personnel grew strongly from the year before. The growth in euros in these services was also biggest among service items. The share of the service item in the turnover of employment activities grew from the previous year's 8 to 14 per cent. In addition, turnover in temporary employment agency services for the supply of personnel in the industries of transportation, warehousing and logistics, as well as trade, grew clearly from one year ago. The shares of these service items in the turnover of employment activities also grew compared with the previous year. The share of transportation, warehousing and logistics of the turnover of employment activities grew from 14 to 16 per cent and that of trade from six to eight per cent.
Of the service items of employment activities, turnover decreased significantly in executive recruitment services and in temporary employment agency services for the supply of marketing and sales personnel. The share of executive recruitment services in the turnover of employment activities went down from five to two per cent. The share of temporary employment agency services for the supply of marketing and sales personnel in the turnover of employment activities was one per cent, having been three per cent one year earlier.
By contrast, the turnover of other human resources provision grew clearly from the year before and the share of the service item in the turnover of employment activities grew from seven to eight per cent.
Ninety-eight per cent of the turnover of employment activities came from Finland. Ninety-one per cent of the turnover was generated from private sector customers.
The statistics do not show the temporary employment agency services sold to Finland by foreign enterprises.
Figure 2. Turnover of the industry of employment activities (TOL 78) by service item in 2018 to 2019, CPA product classification

* Turnover of employment activities (TOL 78) includes CPA product classification categories 78.1 Services provided by employment placement agencies, 78.2 Temporary employment agency services, 78.3 Other human resources provision services
Source: Business services statistics 2019, Statistics Finland
Inquiries: Riitta Savolainen 029 551 3259, yrityspalvelut@stat.fi
Head of Department in charge: Mari Ylä-Jarkko
Publication in pdf-format (188.8 kB)
- Tables
-
Tables in databases
Pick the data you need into tables, view the data as graphs, or download the data for your use.
Updated 9.10.2020
Official Statistics of Finland (OSF):
Statistics on service industry commodities [e-publication].
ISSN=1798-9507. 2019. Helsinki: Statistics Finland [referred: 6.2.2026].
Access method: http://stat.fi/til/palhy/2019/palhy_2019_2020-10-09_tie_001_en.html

