This set of statistics has been discontinued.
New data are no longer produced from the statistics.
Fewer patents were applied for and granted in Finland than in previous years
1. Patents applied for and granted in Finland
1.1 Patents applied for in Finland
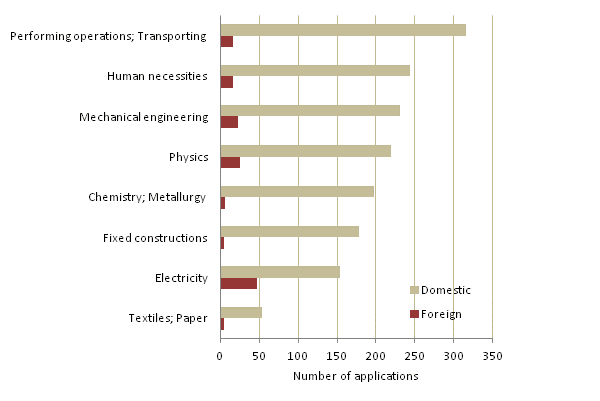
The number of patent applications in Finland decreased by around five per cent from the year before. A total of 1,737 patent applications were filed, of which 1,593 were filed by Finnish applicants and 144 by foreign applicants. Patent applications filed by Finnish enterprises, associations and private citizens decreased from one year ago, while applications by foreigners increased. Most of foreigners' patent applications were directed at electricity (H) and Finns' applications at performing operations and transporting (B) (Figure 1). A majority of foreign applicants came from the United States, but German and Japanese applicants were also active.
Figure 1. Patent applications filed in Finland by IPC section, 2013
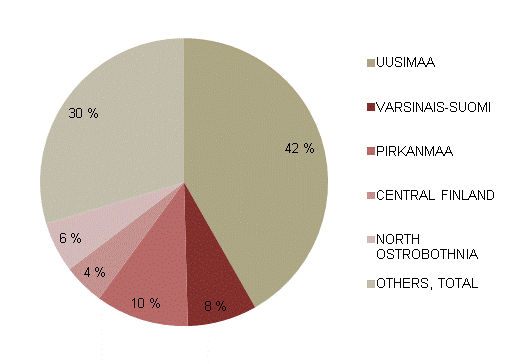
Domestic patent applications by Finnish enterprises and associations decreased by three per cent year-on-year (1,252 applications by 536 enterprises), and viewed by industry, Finnish enterprises and associations applied for most patents directed at the metal industry. When examined by region, the majority of Finnish applicants were located in Uusimaa (42 per cent) and every tenth inventor came from Pirkanmaa. A large number of patent applications were also filed in Varsinais-Suomi, North Ostrobothnia and Central Finland (Figure 2).
Figure 2. Regional distribution of domestic patent applications, 2013
1.2 Patents granted in Finland
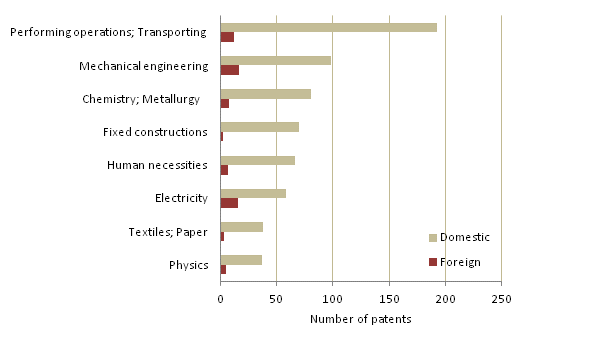
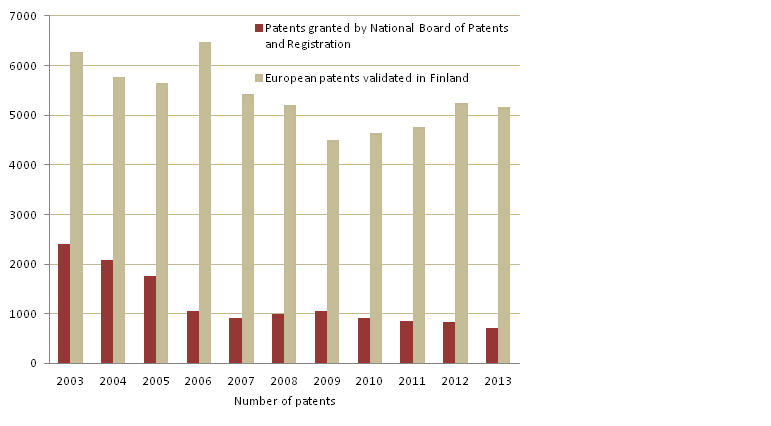
The number of patents granted in Finland continued to contract (Figures 3 and 6). A total of 711 patents were granted in Finland to domestic and foreign applicants, of which the patents received by Finnish enterprises, associations and private citizens numbered 641 and those by foreign applicants 70. In particular, the patents received by foreign applicants in Finland fell drastically, as the number of patents granted to foreigners was nearly halved from one year ago. Patents received by Finnish enterprises, associations and private citizens decreased, in turn, by around nine per cent year-on-year: 573 patents by 239 enterprises.
A majority of the foreign applicants that received patents came from Germany and the United States. Patents granted based on IPC sections were among foreign enterprise applicants most common in mechanical engineering (F) and electricity (H) (Figure 3), and among Finnish applicants in performing operations and transporting (B).
Figure 3. Patents granted in Finland by IPC section, 2013
2. Patents applied for abroad by Finnish inventors
The European Patent Office (EPO) granted a total of 645 patents to Finnish enterprises or associations, which was slightly fewer than one year earlier. The number of enterprises that received patents remained unchanged, however, at 173 enterprises. The most popular main industry for which patents were granted was manufacturing, and nearly one-half of all patents granted to Finns were directed at the electronics industry.
3. Utility designs and European patents in Finland
3.1 Utility design applications in Finland
Slightly more utility design applications were filed in Finland than last year, a total of 480, of which 444 applications were filed by Finnish applicants. Applications filed by foreign enterprises and private citizens increased while applications by Finns remained the same as last year. Among domestic utility design applications the proportion of enterprises was 262 applications and that of private citizens 182 applications. The number of applications filed by private citizens increased by nine, while the number of enterprise applications decreased by the same amount.
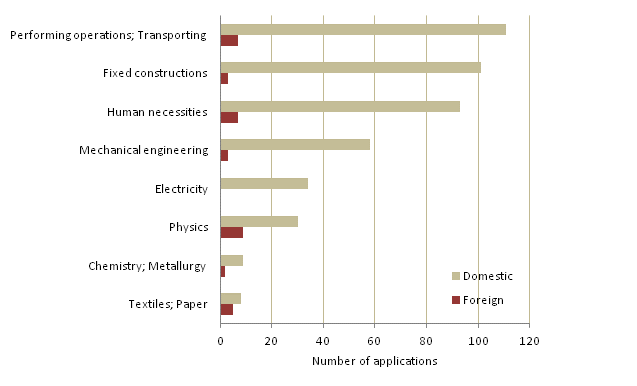
Most domestic applications were filed in the IPC section performing operations and transporting (B), where nearly one-third of the Finnish enterprises having applied filed their utility design application. Foreign applicants favoured the sections human necessities (A), performing operations and transporting (B) and physics (G), and most applications were filed for physics. Unlike patent applications, no foreign applications were filed for the IPC section H, electricity. (Figure 4)
Figure 4. Utility model applications filed in Finland by IPC section, 2013
3.2 European patents validated in Finland
In 2013, a total of 5,164 European patents were validated in Finland, which was 88 fewer patents than in 2012. The main holder countries of the European patents validated in Finland were the United States, Germany and Japan (Figures 5 and 6). The most popular industries of the validated European patents were the IPC sections of chemistry and metallurgy (C) and human necessities (A).
Figure 5. Selected countries shares of European patents validated in Finland, 2012 and 2013
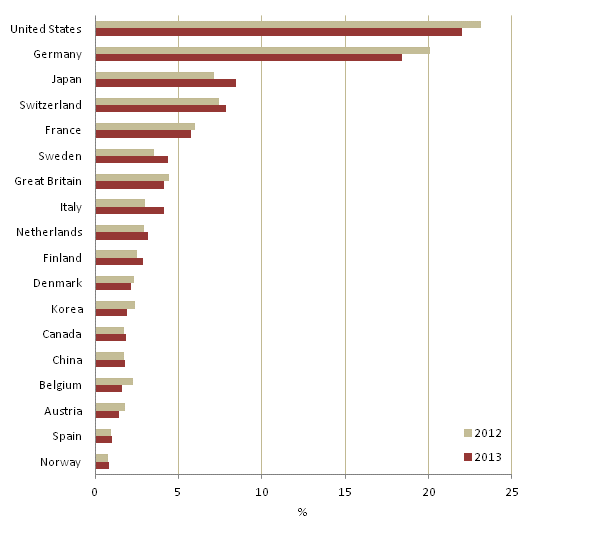
Figure 6. Patents granted and validated in Finland, 2003–2013
Source: Patenting 2013. Statistics Finland
Inquiries: Heidi Pirkola 029 551 3246 , tiede.teknologia@stat.fi
Director in charge: Hannele Orjala
Updated 23.10.2014
Official Statistics of Finland (OSF):
Patenting [e-publication].
ISSN=1797-3023. 2013,
Fewer patents were applied for and granted in Finland than in previous years
. Helsinki: Statistics Finland [referred: 6.2.2026].
Access method: http://stat.fi/til/pat/2013/pat_2013_2014-10-23_kat_001_en.html

