3. Share of families with children in steady decline
At the end of 2009, there were 584,000 families with underage children in Finland. A family with underage children has at least one child under the age of 18 living at home. Families with underage children make up 40 per cent of all families. The percentage has been falling at a steady rate for the past few years. In all, 41 per cent of the population live in families with underage children, older siblings included.
The number of families with underage children decreased by 1,100 from the year before. This decrease is smaller than in the previous year. The number of families with children is decreasing, because the age groups of families expecting their first child are smaller than those celebrating the coming-of-age of their youngest child. In addition, more and more women remain childless, either willingly or unwillingly. For example, 27 per cent of the 35-year-old women born in 1974 are today childless, which equals the proportion last year among women born in 1973. In 1990, 19 per cent of the 35-year-old women born in 1965 were childless. The percentage of mothers in each 1-year age group is now smaller than in 1990 (Population Structure 1990 and Population Structure and Vital Statistics by Municipality 2009).
The number of families with children under the age of seven increased for the fifth consecutive year. In 2009, the number of such families increased by almost 2,900. The natural reason for this is that the number of children born annually has been going up in the early 2000s.
Table 5. Families with underage children by type in 1950–2009
| Year | Total | Married couple with children | Cohabiting couple with children | Mother and children | Father and children | Registered partnership with children | Persons in families with underage children | Families with children aged under 18 | Families with children of all families, % | Population belonging to families with children, % |
| 1950 | 599 329 | 515 115 | .. | 74 319 | 9 895 | .. | .. | 1 341 330 | 64 | .. |
| 1960 | 678 046 | 601 542 | .. | 67 381 | 9 123 | .. | .. | 1 536 464 | 65 | .. |
| 1970 1) | 677 035 | 602 076 | 5 800 | 61 173 | 7 986 | .. | .. | 1 345 089 | 59 | .. |
| 1980 2) | 688 732 | 572 142 | 32 100 | 74 839 | 9 651 | .. | .. | 1 163 926 | 54 | .. |
| 1990 | 640 637 | 490 999 | 59 900 | 78 948 | 10 790 | .. | 2 437 592 | 1 135 686 | 47 | 49 |
| 2000 | 612 627 | 398 892 | 95 120 | 103 984 | 14 631 | .. | 2 317 291 | 1 116 687 | 44 | 45 |
| 2005 | 591 528 | 368 553 | 104 782 | 103 044 | 15 063 | 86 | 2 232 613 | 1 084 865 | 42 | 43 |
| 2006 | 589 448 | 365 326 | 106 422 | 102 469 | 15 111 | 120 | 2 223 718 | 1 080 728 | 41 | 42 |
| 2007 | 587 767 | 362 884 | 107 290 | 102 156 | 15 291 | 146 | 2 216 526 | 1 076 522 | 41 | 42 |
| 2008 | 585 224 | 360 904 | 107 034 | 101 717 | 15 382 | 187 | 2 206 209 | 1 071 800 | 41 | 41 |
| 2009 | 584 172 | 358 871 | 107 377 | 102 146 | 15 549 | 229 | 2 200 603 | 1 068 554 | 40 | 41 |
| % | ||||||||||
| 1950 | 100,0 | 85,9 | .. | 12,4 | 1,7 | .. | .. | .. | .. | .. |
| 1960 | 100,0 | 88,7 | .. | 9,9 | 1,3 | .. | .. | .. | .. | .. |
| 1970 | 100,0 | 88,9 | 0,9 | 9,0 | 1,2 | .. | .. | .. | .. | .. |
| 1980 | 100,0 | 83,1 | 4,7 | 10,9 | 1,4 | .. | .. | .. | .. | .. |
| 1990 | 100,0 | 76,6 | 9,4 | 12,3 | 1,7 | .. | .. | .. | .. | .. |
| 2000 | 100,0 | 65,1 | 15,5 | 17,0 | 2,4 | .. | .. | .. | .. | .. |
| 2005 | 100,0 | 62,3 | 17,7 | 17,4 | 2,5 | 0,0 | .. | .. | .. | .. |
| 2006 | 100,0 | 62,0 | 18,1 | 17,4 | 2,6 | 0,0 | .. | .. | .. | .. |
| 2007 | 100,0 | 61,7 | 18,3 | 17,4 | 2,6 | 0,0 | .. | .. | .. | .. |
| 2008 | 100,0 | 61,7 | 18,3 | 17,4 | 2,6 | 0,0 | .. | .. | .. | .. |
| 2009 | 100,0 | 61,4 | 18,4 | 17,5 | 2,7 | 0,0 | .. | .. | .. | .. |
2) The breakdown of the census by type of family has been revised on the basis of the 1981 register-based material on families and cohabiting couples.
3.1 Commonest type of family of married couples still includes underage children
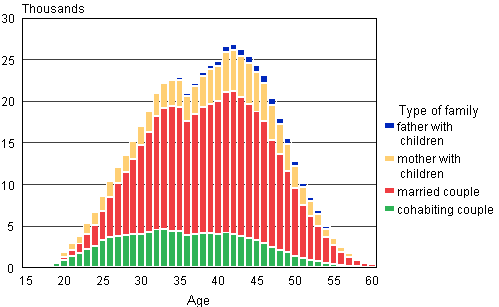
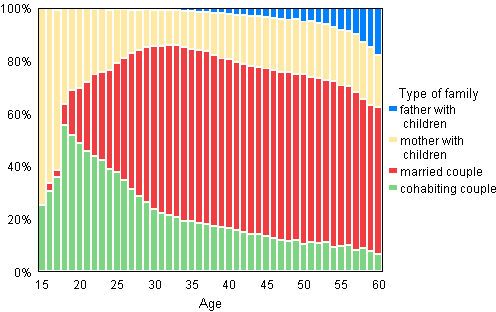
By far the most common type of family with underage children is still that of a married couple. In 61 per cent of all families with underage children the supporters are a married couple. On the other hand, this is the only form of family with children for which the absolute number and relative proportion have been falling continuously. Nevertheless, its dominance is unlikely to be threatened by any other family form for years to come. Among the families with underage children, the numbers of the types cohabiting couple with children, mother with children, father with children and registered couple with children increased during the year. At the end of 2009, there were 107,400 families of cohabiting couples with underage children in Finland, equalling 18 per cent of all families with underage children.
Nowadays, 54 per cent of first-born children are born outside of marriage. The proportion has hardly varied at all since 1999. Thirty-seven per cent of second-born children and 28 per cent of third-born children are born to parents who are not married to each other (Vital Statistics 2009). Altogether 41 per cent of all children born in 2009 were born out of wedlock.
The number of families with children of the type mother and children (102,100) has gone up slightly from the year before. However, their share of all families with children has remained unchanged. One-fifth of all families with underage children are one-parent families (of the type mother and children or father and children). Families with children whose regular composition is father and children are still quite rare in Finland, their number being only 15,500. Families composed of a registered couple and children under the age of 18 are even rarer, and only number 229.
Figure 5A. Families with underage children by type of family and age of mother/single father in 2009

Figure 5B. Families with underage children by type of family and age of mother/single father in 2009, relative breakdown

3.2 Less than half of parents of reconstituted families are married to each other
A reconstituted family refers to a family that has a non-common child under the age of 18, i.e. the child has, in a sense, received a new social parent. In colloquial and everyday language the concept is used in a broader sense: weekend families formed as a result of various divorce arrangements are referred to as reconstituted families. However, statistics on families must be compiled according to the child’s permanent place of residence. One child cannot be recorded in statistics as belonging to two families. Divorced fathers and mothers with whom children only stay during weekends and holidays are not included in family statistics, unless they have formed a new family.
Reconstituted families account for nine per cent (54,000) of all families with underage children. The number of reconstituted families has grown slowly ever since the first statistics on them were compiled in 1990. In 2009, the number decreased by 90 families.
Altogether 49 per cent of the parents of reconstituted families are married to one another and the rest cohabit. Usually, the child of a reconstituted family is the mother’s and has obtained a new social father. If a common child is born to a reconstituted family, the parents most often marry, otherwise the spouses tend to cohabit. Families with “your children, my children and our children” living in the same household are still rare, numbering only 744.
Table 6. Reconstituted families 1990–2009
| Year | Total | Married couple | Cohabiting couple | Reconstituted families as a proportion of families with children, % | Mother's children | Father's children | Common children | Children under 18 in reconstituted families | Non-common children as a proportion of children of all families, % | Children in reconstituted families as aproportion of children of all families, % |
| 1990 | 44 426 | 21 808 | 22 618 | 6,9 | 50 713 | 7 443 | 30 089 | 88 245 | 5,1 | 7,8 |
| 1995 | 42 460 | 19 197 | 23 263 | 6,6 | 50 322 | 7 637 | 29 242 | 87 201 | 5,0 | 7,6 |
| 2000 | 47 288 | 21 315 | 25 973 | 7,7 | 58 550 | 8 541 | 30 931 | 98 022 | 6,0 | 8,8 |
| 2001 | 48 359 | 21 846 | 26 513 | 8,0 | 60 272 | 8 916 | 31 086 | 100 274 | 6,3 | 9,1 |
| 2002 | 49 294 | 22 431 | 26 863 | 8,2 | 61 816 | 9 120 | 31 226 | 102 162 | 6,5 | 9,3 |
| 2003 | 49 944 | 22 888 | 27 056 | 8,4 | 63 071 | 9 198 | 31 565 | 103 834 | 6,6 | 9,5 |
| 2004 | 50 867 | 23 872 | 26 995 | 8,6 | 64 503 | 9 366 | 32 040 | 105 909 | 6,8 | 9,7 |
| 2005 | 52 204 | 24 722 | 27 482 | 8,8 | 66 228 | 9 746 | 32 465 | 108 439 | 7,0 | 10,0 |
| 2006 | 52 920 | 25 275 | 27 645 | 9,0 | 67 175 | 10 054 | 32 817 | 110 071 | 7,1 | 10,2 |
| 2007 | 53 482 | 25 901 | 27 581 | 9,1 | 67 652 | 10 254 | 33 064 | 110 970 | 7,2 | 10,3 |
| 2008 | 53 674 | 26 415 | 27 259 | 9,2 | 67 463 | 10 378 | 33 227 | 111 068 | 7,3 | 10,4 |
| 2009 | 53 584 | 26 516 | 27 068 | 9,2 | 67 154 | 10 517 | 33 016 | 110 687 | 7,3 | 10,4 |
3.3 Number of children in families with underage children
When examining the number of children in families, allowance must be made for the family’s stage of life. For example, families which have only had their first born are processed as one-child families in statistics, as are also families with only their last-born still living at home. Family statistics thus represent a cross-section of the situation at a given moment, i.e. the sizes of families in the country at a given point in time, and do not describe the eventual numbers of children in families. Hence, it is difficult to compare the statistics relating to different points in time because of the uneven age structure of the population.
The clearest change in the number of children in families in the long term is the fall in the number and relative proportion of families with at least four children since the post-war period (Table 7). However, the proportion of these large families among families with children has increased slightly since the 1990s, even though especially in recent years any changes have been quite minor.
The number of families with just one underage child has grown by around 600 from the previous year. At the end of 2009, families with one child accounted for 43.6 per cent of all families with underage children.
At the end of 2009, one family with 15 underage children led the statistics on the number of children. When all children living at home are taken into account, the largest families in Finland also have 15 children.
Table 7. Number of children in families with underage children 1950–2009
| Year | Families total | 1 | 2 | 3 | 4- | Average number of children aged under 18 |
| 1950 | 599 329 | 234 682 | 173 092 | 95 100 | 96 455 | 2,24 |
| 1960 | 678 046 | 253 285 | 202 408 | 112 446 | 109 907 | 2,27 |
| 1970 | 677 035 | 287 649 | 222 276 | 100 358 | 66 752 | 1,99 |
| 1980 | 688 732 | 333 812 | 264 944 | 70 100 | 19 876 | 1,69 |
| 1990 | 640 637 | 286 549 | 250 317 | 81 163 | 22 608 | 1,77 |
| 2000 | 612 627 | 268 369 | 230 758 | 85 025 | 28 475 | 1,82 |
| 2005 | 591 528 | 255 549 | 225 879 | 81 775 | 28 325 | 1,83 |
| 2006 | 589 448 | 254 705 | 225 714 | 80 794 | 28 235 | 1,83 |
| 2007 | 587 767 | 254 832 | 225 044 | 79 594 | 28 297 | 1,83 |
| 2008 | 585 224 | 253 841 | 224 508 | 78 550 | 28 325 | 1,83 |
| 2009 | 584 172 | 254 457 | 223 777 | 77 528 | 28 410 | 1,83 |
| % | ||||||
| 1950 | 100,0 | 39,2 | 28,9 | 15,9 | 16,1 | .. |
| 1960 | 100,0 | 37,4 | 29,9 | 16,6 | 16,2 | .. |
| 1970 | 100,0 | 42,5 | 32,8 | 14,8 | 9,9 | .. |
| 1980 | 100,0 | 48,5 | 38,5 | 10,2 | 2,9 | .. |
| 1990 | 100,0 | 44,7 | 39,1 | 12,7 | 3,5 | .. |
| 2000 | 100,0 | 43,8 | 37,7 | 13,9 | 4,6 | .. |
| 2005 | 100,0 | 43,2 | 38,2 | 13,8 | 4,8 | .. |
| 2006 | 100,0 | 43,2 | 38,3 | 13,7 | 4,8 | .. |
| 2007 | 100,0 | 43,4 | 38,3 | 13,5 | 4,8 | .. |
| 2008 | 100,0 | 43,4 | 38,4 | 13,4 | 4,8 | .. |
| 2009 | 100,0 | 43,6 | 38,3 | 13,3 | 4,9 | .. |
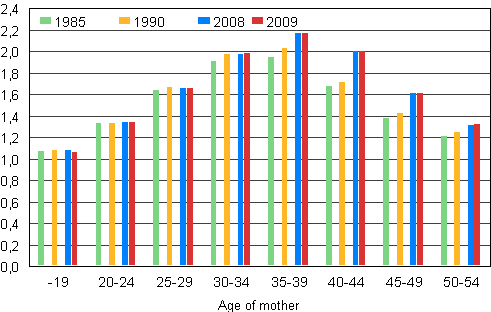
The average number of children in a family with underage children is not directly comparable at different points in time, because the sizes of the age groups at various stages of family life vary. The figures should be age-standardised. However, this does not give exactly unambiguous information either, since childbearing age has continuously risen. Therefore, the youngest age groups in 1985 cannot be compared direct with today’s youngest age groups, as at the moment women bearing their first child are, on the average, two years older than at that time. The number of children in families with children has fallen each year since the beginning of the 1990s.
The recent trend can be seen in Figure 6, which shows the average number of underage children living at home according to the mother's age group. The fact that women giving birth have become older is visible in that mothers aged over 40 have almost the same number of children in each age group as in the previous year and clearly more than in 1990. Mothers aged under 35 have roughly the same number of children as in the year before and in 1990.
Figure 6. Average number of children in families with underage children by age of mother in 1985, 1990, 2008 and 2009

Source: Population and Cause of Death Statistics, Statistics Finland
Inquiries: Marjut Pietiläinen (09) 1734 2798, Timo Nikander (09) 1734 3250, vaesto.tilasto@stat.fi
Director in charge: Jari Tarkoma
Updated 30.11.2010
Official Statistics of Finland (OSF):
Families [e-publication].
ISSN=1798-3231. Annual Review 2009,
3. Share of families with children in steady decline
. Helsinki: Statistics Finland [referred: 12.2.2026].
Access method: http://stat.fi/til/perh/2009/02/perh_2009_02_2010-11-30_kat_003_en.html

