

Published: 14 January 2022
Turnover and output in services grew in November
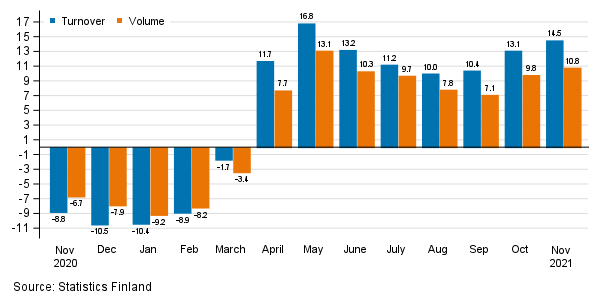
According to Statistics Finland, working day adjusted turnover in service industries grew by 14.5 per cent in November 2021 from November 2020. Service output or volume, from which the impact of prices has been eliminated, grew by 10.8 per cent over the same period. In October 2021, turnover reached a growth of 13.1 per cent, while volume went up by 9.8 per cent from one year back. The development was partly due to the exceptional situation caused by the coronavirus one year earlier. Services are here examined exclusive of trade.
Annual change in working day adjusted turnover and volume of service industries, %
Service industries most hit by corona still behind November 2019
Growth in working day adjusted turnover in service industries accelerated in November 2021 to 4.4 per cent compared to November 2019 prior to the coronavirus period. In the corresponding period, the volume of service industries grew by 3.3 per cent. However, for some service industries, the development of working day adjusted turnover and volume still remained on a lower level than in November 2019.
In November 2021, development in arts, entertainment and recreation activities was still clearly lower than in the corresponding period of 2019. The working day adjusted turnover of the industry decreased by 27.4 per cent from November 2019. Correspondingly, turnover in accommodation and food service activities was 5.5 per cent lower and volume 7.1 per cent lower than in November of the year prior to the coronavirus period. At the same time, working day adjusted turnover in transportation and storage, in turn, reached a slight growth of 0.2 per cent, while the volume of the industry was still falling by 4.0 per cent.
Main service industries grew except arts, entertainment and recreation activities
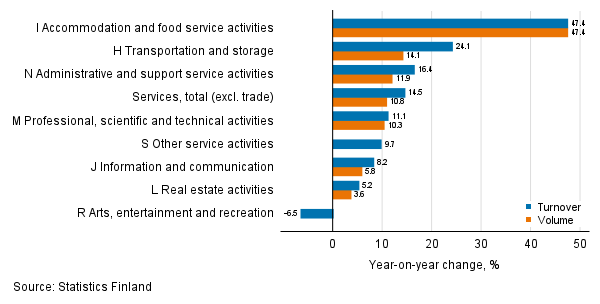
Turnover and volume grew in nearly all main service industries in November 2021. Only the turnover in arts, entertainment and recreation activities declined from the previous year, being 6.5 per cent lower. Adjusted for working days, turnover and volume in accommodation and food service activities rose by as much as 47.4 per cent from November 2020. In transportation and storage, turnover went up by 24.1 per cent while volume grew by 14.1 per cent. In administrative and support service activities, working day adjusted turnover rose by 16.4 per cent and volume by 11.9 per cent from November the year before.
In other main service industries, development was more subdued than the average development in service industries. In November 2021, working day adjusted turnover in professional, scientific and technical activities increased by 11.1 per cent and volume by 10.3 per cent from the year before. The working day adjusted turnover of other service activities went up by 9.7 per cent from November 2020.
In the industry of information and communication, working day adjusted turnover grew by 8.2 per cent in November 2021 while the volume of the industry was growing by 5.8 per cent over the same period. Working day adjusted turnover in real estate activities, in turn, went up by 5.2 per cent and volume by 3.6 per cent from November 2020.
Annual change in working day adjusted turnover and volume of service industries, November 2021, % (TOL 2008)
Turnover and output grew from the previous month
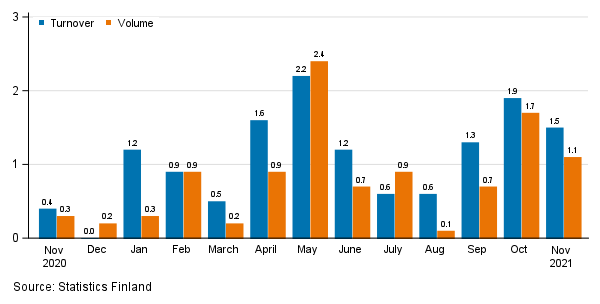
Seasonally adjusted turnover in service industries rose by 1.5 per cent in November 2021 compared with October. The output of services, from which the impact of prices has been eliminated, grew by 1.1 per cent over the same period. In October of 2021, turnover grew by 1.9 per cent from September, while volume was up by 1.7 per cent.
Change in seasonally adjusted turnover and volume from the previous month of service industries, %
The data for the latest month are preliminary and are released at a delay of around six weeks. The data may become significantly revised particularly on more detailed industry levels in coming months. The volume of service industries is calculated by eliminating the effect of price changes from the turnover index.
The factors caused by the variation in the number of weekdays are taken into account in adjustment for working days. This means taking into consideration the lengths of months, different weekdays and holidays. In addition, seasonal variation is eliminated from seasonally adjusted series, on account of which it makes sense to compare observations of two successive months as well.
Source: Turnover of service industries, Statistics Finland
Inquiries: Aki Niskanen 029 551 2657, Katja Liukkonen 029 551 3515, Tony Valve 029 551 3453, myynti.palvelut@stat.fi
Head of Department in charge: Katri Kaaja
Publication in pdf-format (391.9 kB)
- Tables
-
Tables in databases
Pick the data you need into tables, view the data as graphs, or download the data for your use.
Appendix tables
- Figures
-
- Appendix figure 1. Turnover and volume of service industries, trend series (14.1.2022)
- Appendix figure 2. Turnover and volume of transportation and storage, trend series (14.1.2022)
- Appendix figure 3. Turnover and volume of information and communication, trend series (14.1.2022)
- Appendix figure 4. Turnover and volume of real estate activities, trend series (14.1.2022)
- Appendix figure 5. Turnover and volume of professional, scientific and technical activities, trend series (14.1.2022)
- Appendix figure 6. Turnover and volume of administrative and support service activities, trend series (14.1.2022)
- Revisions in these statistics
-
- Revisions in these statistics (14.1.2022)
Updated 14.1.2022
Official Statistics of Finland (OSF):
Turnover of service industries [e-publication].
ISSN=1799-0998. November 2021. Helsinki: Statistics Finland [referred: 21.7.2026].
Access method: http://stat.fi/til/plv/2021/11/plv_2021_11_2022-01-14_tie_001_en.html