

This set of statistics has been discontinued.
Statistical data on this topic are published in connection with another set of statistics.
Data published after 5 April 2022 can be found on the renewed website.
Published: 2 April 2013
Income of persons suspected of offences lower than for the whole population
According to Statistics Finland's data, the number of persons suspected of the offences solved in 2012 by the police, customs and border guard was 284,000. Compared to the previous year, the number of all suspects decreased by six per cent. Average income (income subject to state tax) of suspects aged 15 or over belonging to the registered population was approximately EUR 12,000 while the corresponding income for the entire population was approximately EUR 26,000. The respective median incomes were approximately EUR 6,600 and EUR 22,000.
Persons suspected of offences and the entire population by income subject to state taxation in 2012, aged 15 years and over, %
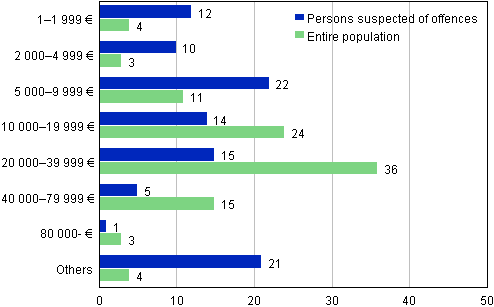
Of the suspects, 22 per cent had an income of under EUR 5,000 while the corresponding share for the entire population was seven per cent. Twenty-one per cent of the suspects had an income of at least EUR 20,000 while the share for the entire population was 54 per cent. Offences where the suspects had especially low income subject to state tax were robberies and narcotics offences in particular. The income subject to state tax was under EUR 5,000 for one-third of robbery suspects and one-quarter of narcotics offence suspects. At higher income levels, the most common offences were drunken driving, embezzlement and tax offences, and accounting offences. Sixteen per cent of drunken driving suspects, 14 per cent of embezzlement suspects, nine per cent of tax offence suspects and ten per cent of accounting offence suspects had an income of under EUR 5,000. The income levels of female and male suspects differed only little from one another. Forty-four per cent of men and 48 per cent of women had less than EUR 10,000 in income.
In the statistics the same person can be a suspect several times. The data on income subject to state tax of suspects are based on the National Board of Taxes' data in the tax database concerning income subject to state taxation from 2011. The taxation data of suspects with no personal identity code are not known. Such persons include, for instance, tourists. The group "others" includes members of the registered population (persons permanently or temporarily residing in Finland) with no income or that are unknown, but not persons without personal identity codes.
Persons aged 15 years and over suspected of offences and the entire population by age and income in 2012, %
| Age groups | Persons suspected/ Entire population |
Total | Less than 10 000 € |
10 000– 39 999 € |
40 000 € and over |
Others |
| Total | Persons suspected | 100,0 | 44,6 | 28,4 | 5,9 | 21,1 |
| Entire population | 100,0 | 18,4 | 60,1 | 17,7 | 3,8 | |
| 15–20 | Persons suspected | 20,1 | 12,0 | 1,3 | 0,0 | 6,8 |
| Entire population | 8,8 | 5,7 | 0,9 | 0,0 | 2,1 | |
| 21–29 | Persons suspected | 29,4 | 13,4 | 8,4 | 0,7 | 7,0 |
| Entire population | 13,5 | 3,9 | 8,4 | 0,8 | 0,4 | |
| 30–39 | Persons suspected | 22,3 | 9,6 | 7,0 | 1,6 | 4,1 |
| Entire population | 14,7 | 1,8 | 8,6 | 3,8 | 0,4 | |
| 40–49 | Persons suspected | 15,4 | 5,8 | 5,5 | 1,9 | 2,2 |
| Entire population | 15,8 | 1,6 | 8,7 | 5,2 | 0,4 | |
| 50–59 | Persons suspected | 8,6 | 3,0 | 3,5 | 1,2 | 0,9 |
| Entire population | 16,7 | 1,8 | 9,8 | 4,8 | 0,3 | |
| 60– | Persons suspected | 4,1 | 0,7 | 2,7 | 0,5 | 0,1 |
| Entire population | 30,5 | 3,5 | 23,6 | 3,2 | 0,1 |
Of suspects aged 15 or over, 63 per cent have completed only basic level education and 31 per cent have completed secondary level education. The respective figures for the whole population are 32 and 40 per cent.
Viewed by main activity, suspects aged 15 or over are divided quite evenly into employed persons (27%), unemployed persons (22%) and inactive population (23%). The share of pensioners was nine per cent. Among the entire population the biggest groups are employed persons (52%) and pensioners (29%). Employed persons committed mainly rape offences (67%), dishonesty by a debtor (61%) and tax offences (51%). Unemployed persons in turn committed narcotics offences (29%) and forgeries (27%).
The publication also contains data on the suspects' socio-economic group.
In 2012, a total of 425,000 offences were recorded by the police, customs and border guard. This was 33,000 down from the year before. In addition, 435,000 cases of endangerment of traffic safety and traffic offences were recorded, which is 69,000 cases less than in the previous year.
The presentation of the statistics was revised as of the beginning of 2009. Endangerment of traffic safety and traffic offences are separated from other offences and they are presented in a separate table. The total number of offences is comparable with earlier figures, because the same division has also been made retrospectively until 1980. The aim of the revision is to improve the comparability of offences between different years and enhance their international comparability. The quality description of the statistics contains more detailed annual information about revisions but it is regrettably only published in Finnish.
From the beginning of 2009, offences recorded by the customs and border guard are also included. The change does not have much effect on the comparability of offences. Of the most common types of offences the change primarily affects the comparability of narcotics offences.
Source: Offences known to the police 2012. Statistics Finland
Inquiries: Kimmo Haapakangas 09 1734 3252, rikos@stat.fi
Director in charge: Riitta Harala
Publication in pdf-format (25 pages 457.5 kB)
- Reviews
- Tables
-
Tables in databases
Pick the data you need into tables, view the data as graphs, or download the data for your use.
Appendix tables
- Appendix table 1. Development of certain types of offences in 2008 - 2012 (2.4.2013)
- Appendix table 2. Development of endangerment of traffic safety and number of traffic infractions in 2008 - 2012 (2.4.2013)
- Appendix table 3. Munincipal parking supervision 2012 (2.4.2013)
- Appendix table 4. Persons suspected of offences by nationality in 2008 - 2012 (2.4.2013)
- Appendix table 5. Persons suspected of offences and the entire population by income subject to state taxation, aged 15 years and over (2.4.2013)
- Appendix table 6. Persons suspected of offences and the entire population by socio-economic status, aged 15 years and over (2.4.2013)
- Appendix table 7. Persons suspected of offences and the entire population by main activity, aged 15 years and over (2.4.2013)
- Appendix table 8. Persons suspected of offences and the entire population by level of education, aged 15 years and over (2.4.2013)
- Figures
-
- Appendix figure 1. Persons suspected of offences and the entire population by socio-economic status, aged 15 years and over, % (2.4.2013)
- Appendix figure 2. Persons suspected of offences and the entire population by main activity, aged 15 years and over, % (2.4.2013)
- Appendix figure 3. Persons suspected of offences and the entire population by level of education, aged 15 years and over, % (2.4.2013)
Updated 2.4.2013
Official Statistics of Finland (OSF):
Offences known to the police [e-publication].
ISSN=2242-7953. 2012. Helsinki: Statistics Finland [referred: 20.7.2026].
Access method: http://stat.fi/til/polrik/2012/polrik_2012_2013-04-02_tie_001_en.html