Published: 20 January 2022
Share of imported products in intermediate consumption 27 per cent in 2019
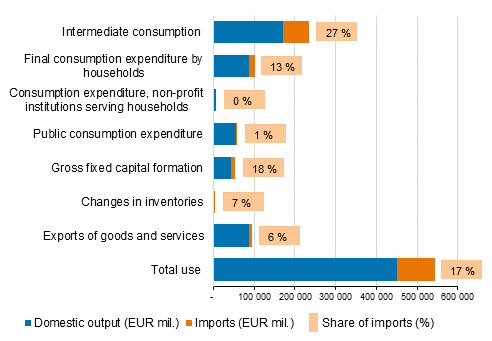
According to Statistics Finland's input-output statistics, imported products accounted for 27 per cent of intermediate consumption in 2019. The import shares by use category were next biggest in gross fixed capital formation (18 per cent) and households' consumption expenditure (13 per cent). On the level of the whole economy, the average share of imports of use categories was 17 per cent and correspondingly, the share of domestic output was 83 per cent of the combined use of domestic output and imports.
Use at basic prices, EUR million, and share of imported products in use at basic prices in 2019

The different import shares of use categories are caused by different product structures of use categories and different import shares of products. The differences are most clearly explained by the division of use into goods and service products and larger shares of imports of goods products than service products. In intermediate consumption, the share of goods in the combined use of goods and services was 37 per cent, and one-half of goods were imports. Correspondingly, in gross fixed capital formation, the share of goods in the combined use of goods and services was 17 per cent, and 75 per cent of goods were imports. The values and import shares of use categories domestic output and imports are based on the data of the input-output tables “Use table at basic prices” and “Use table for imports at basic prices”.
The supply and use tables describe the flows of goods and services in the economy from supply to use. The supply consists of domestic output and imports. The use is divided into intermediate consumption, consumption expenditure, gross capital formation (investments, i.e. gross fixed capital formation, and change in inventories) and exports of goods and services. The supply and use data are valued at basic prices and at purchaser's prices. The basic price is the price exclusive of taxes on products (value added tax, import duties and other taxes on products, such as excise duties).
Statistics Finland publishes annually the supply and use tables describing product flows in the national economy, and the input-output and analysis tables derived from them. The data published now concern the year 2019. Tables concerning 2020 will be published in December 2022.
Source: Input-output 2019, Statistics Finland.
Inquiries: Markku Räty 029 551 2647, Ville Lindroos 029 551 3323, kansantalous@stat.fi
Head of Department in charge: Katri Kaaja
Publication in pdf-format (162.6 kB)
- Tables
-
Tables in databases
Pick the data you need into tables, view the data as graphs, or download the data for your use.
Updated 20.1.2022
Official Statistics of Finland (OSF):
Input-output [e-publication].
ISSN=1799-201X. 2019. Helsinki: Statistics Finland [referred: 19.2.2026].
Access method: http://stat.fi/til/pt/2019/pt_2019_2022-01-20_tie_001_en.html

