Published: 24 April 2012
Producer prices for services went up by 2.6 per cent in January–March
According to Statistics Finland, producer prices for services went up by 2.6 per cent in the first quarter of 2012 from the corresponding quarter of the year before.
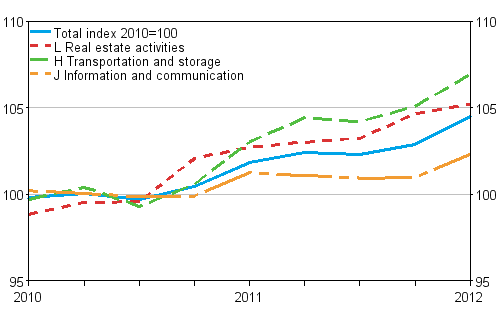
Producer price index for services 2010=100 (TOL 2008), Q1/2010–Q1/2012

The rise in producer prices for services was especially due to higher prices of goods transport by road compared to the year before. The rising of prices was also influenced by increases in the rents of construction machinery and equipment, computer programming and consultancy as well as engineering activities. The rise in prices was curbed most by decreases in the prices of telecommunications.
From fourth to first quarter producer prices for services went up by 1.6 per cent. This was mainly due to higher prices of goods transport by road.
Producer price index for services 2010=100 (TOL 2008), 1st quarter 2012
| Industry | Point figure | Quarterly change,% | Yearly change,% |
| Total index (TOL 2008) | 104.5 | 1.6 | 2.6 |
| H Transportation and storage | 106.9 | 1.8 | 3.8 |
| I Accommodation and food service activities | 107.7 | 2.5 | 3.4 |
| J Information and communication | 102.3 | 1.3 | 1.1 |
| L Real estate activities | 105.2 | 0.5 | 2.4 |
| M Professional, scientific and technical activities | 102.4 | 1.3 | 2.1 |
| N Administrative and support service activities | 107.4 | 3.0 | 4.6 |
| P Education | 102.5 | 0.5 | 0.5 |
| Q Human health and social work activities | 107.3 | 3.0 | 3.0 |
| R Arts, entertainment and recreation | 105.6 | 1.0 | 2.8 |
| S Other service activities | 104.9 | 1.5 | 3.4 |
Producer price indices for services describe the price development in business services provided by enterprises to other enterprises and the public sector. The total index currently covers 57 per cent of the market services.
Producer price indices for services have been revised
The Producer price indices for services have been revised and their base years changed to 2010. In connection with the revision, the weight structure of the index has been brought in line with the strucuture of service production. In addition, the service and enterprise samples have been updated.
The industries 491 Passenger rail transport, interurban, 56 Food and beverage service activities, 6831 Real estate agencies, 85 Education, 86 human health activities, 90 Creative, arts and entertainment activities, 93 Sports activities and amusement and recreation activities and 95 Repair of computers and personal and household goods were included to the index.
In the future indices will be published on the 24th day of the month following the statistical reference quarter, or on the first working day following it.
Source: Producer Price Index for Services 2012, 1st quarter. Statistics Finland
Inquiries: Suvi Kivi 09 1734 3725, Satu Sitkiä-Vikholm 09 1734 3424, pthi.tilastokeskus@stat.fi
Director in charge: Kari Molnar
Publication in pdf-format (274.7 kB)
- Tables
-
Tables in databases
Pick the data you need into tables, view the data as graphs, or download the data for your use.
Appendix tables
- Quality descriptions
Updated 24.4.2012
Official Statistics of Finland (OSF):
Producer price indices for services [e-publication].
ISSN=1798-3940. 1st quarter 2012. Helsinki: Statistics Finland [referred: 12.2.2026].
Access method: http://stat.fi/til/pthi/2012/01/pthi_2012_01_2012-04-24_tie_001_en.html

