Published: 24 January 2022
Producer prices for services grew by 2.6 per cent year-on-year in October to December
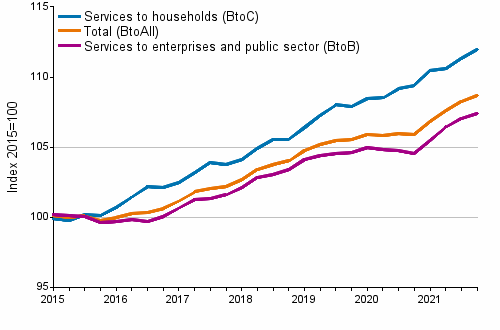
According to Statistics Finland, the annual change in the Producer Price Index for Services was 2.6 per cent in the fourth quarter of 2021. Compared to the previous quarter, producer prices for services rose by 0.4 per cent.
Producer Price Indices for Services 2015=100, I/2015–IV/2021

Producer prices for services were pushed up particularly by higher prices of support services for transportation together with freight transport services by road from one year ago. The price increase was also affected by higher prices of food services and human health services. The rise in the prices was held back by fallen prices of renting services of construction machinery and equipment, as well as warehousing and storage services, for example.
Producer prices for services for enterprises and the public sector (Business to Business, BtoB) were boosted in particular by higher prices of support services for transportation from one year ago. The rise was held back by fallen prices of renting services of construction machinery and equipment, among other things. Producer prices for services for households (Business to Consumers, BtoC) were, in turn, pushed up particularly by higher prices of food services and human health services from one year ago. The rise was held back by, for example, lower prices of water transport services.
Producer Price Indices for Services 2015=100, total (BtoAll), 4th quarter 2021
| Services by activity | Point figure | Quarterly change,% | Annual change,% |
| TOTAL INDEX | 108.7 | 0.4 | 2.6 |
| H TRANSPORTATION AND STORAGE SERVICES | 114.7 | 2.1 | 8.3 |
| I ACCOMMODATION AND FOOD SERVICES | 111.7 | 0.9 | 2.8 |
| J INFORMATION AND COMMUNICATION SERVICES | 104.3 | 0.5 | 0.7 |
| L REAL ESTATE SERVICES | 109.0 | 0.4 | 1.6 |
| M PROFESSIONAL, SCIENTIFIC AND TECHNICAL SERVICES | 106.0 | -0.9 | 0.8 |
| N ADMINISTRATIVE AND SUPPORT SERVICES | 102.1 | -0.2 | 0.8 |
| P EDUCATION SERVICES | 106.8 | 0.1 | -0.5 |
| Q HUMAN HEALTH AND SOCIAL WORK SERVICES | 118.6 | 0.0 | 4.4 |
| R ARTS, ENTERTAINMENT AND RECREATION SERVICES | 108.2 | 0.5 | 2.8 |
| S OTHER SERVICES | 108.0 | 0.1 | 0.9 |
Producer Price Indices for Services currently cover about 60 per cent of the market services.
Source: Producer Price Indices for Services 2021, 4th quarter. Statistics Finland
Inquiries: Ville Auno 029 551 3023, pthi.tilastokeskus@stat.fi
Head of Department in charge: Katri Kaaja
Publication in pdf-format (327.2 kB)
- Tables
-
Tables in databases
Pick the data you need into tables, view the data as graphs, or download the data for your use.
Appendix tables
- Appendix table 1. Producer Price Indices for Services 2015=100, total (BtoAll), 4th quarter 2021 (24.1.2022)
- Appendix table 2. Producer Price Indices for Services 2015=100, services to enterprises and public sector (BtoB), 4th quarter 2021 (24.1.2022)
- Appendix table 3. Producer Price Indices for Services 2015=100, services to households (BtoC), 4th quarter 2021 (24.1.2022)
- Appendix table 4. Producer Price Indices for Services 2010=100, services to enterprises and public sector (BtoB), 4th quarter 2021 (24.1.2022)
- Quality descriptions
Updated 24.01.2022
Official Statistics of Finland (OSF):
Producer price indices for services [e-publication].
ISSN=1798-3940. 4th quarter 2021. Helsinki: Statistics Finland [referred: 19.2.2026].
Access method: http://stat.fi/til/pthi/2021/04/pthi_2021_04_2022-01-24_tie_001_en.html

