This set of statistics has been discontinued.
Statistical data on this topic are published in connection with another set of statistics.
Data published after 5 April 2022 can be found on the renewed website.
Published: 25 November 2015
International trade in services over EUR 2 billion in surplus
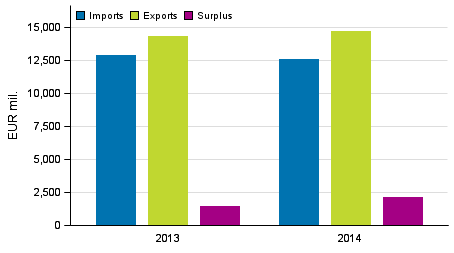
According to Statistics Finland's data, the growth in exports of services and correspondingly, the fall in imports increased the surplus in service trade in 2014. Computer and information services generated most surplus, over EUR four billion. In addition, user licenses of results from R&D activity produced a surplus of over EUR one billion. In total, surplus from service trade was EUR 2.1 billion in 2014.
Service imports, exports and surplus in 2013 to 2014, EUR million

Service exports grew by three per cent in 2014 compared with the previous year, to EUR 14.7 billion, while service imports went down by two per cent to EUR 12.6 billion. Therefore, surplus in service trade grew by as much as 45 per cent compared with the previous year. The value of net sales of goods processed abroad and of merchanting went down by nearly EUR one billion from the year before. The value from this item was EUR 1.9 billion in 2014 while it had been EUR 2.8 billion in 2013.
Sales margin from goods manufactured abroad in 2013 to 2014, EUR million
| Item | 2013 | 2014 |
| Net sales of goods processed abroad and of merchanting | 2 810 | 1 868 |
Service imports divide more evenly than exports
Nearly one-half of service exports is generated from computer and information services, whose share in total exports is 43 per cent. Compared with 2013, exports of computer and information services increased by close on 30 per cent. In addition to computer and information services, other considerable items in service exports in 2014 were technical, trade-related and other business services, user licences of results from R&D activity, as well as construction abroad and project deliveries abroad. Together, these items cover nearly 80 per cent of service exports. Of these, exports of user licences of results from R&D activity, as well as construction abroad and project deliveries abroad decreased by one-third compared with the previous year.
Service imports are divided more than exports between service items and no individual item emerges there. Nearly one-half of service imports come from telecommunications, computer and information services, research and development services, and advertising, market research and public opinion polling. Of these, computer and information services cover nearly one-fifth of service imports. Compared with 2013, imports of trade-related services increased by close on 80 per cent. Research and development services, and business and management consulting services produce most deficit to service trade. Both of these items show a deficit of over EUR one billion.
Service exports and imports biggest from the EU area
Examined by area, the main trade partners have remained unchanged from 2013. Countries in the European Union cover 68 per cent of imports and 57 per cent of exports. Sweden covers around one-quarter of both service exports and imports in the EU area. The most significant change in country-specific figures was a decrease in service imports from Ireland to nearly one-half from 2013.
Among Asian countries, Finland's main trading partner in service exports in 2014 was Japan, whose share in service exports to Asia was good one-fifth. In terms of service imports, China remained the main trade partner with a share of good 40 per cent of total Asian imports. In terms of America, the share of the United States was most important both in exports and imports in 2014 as well.
Differences in regional divisions of services
The regional divisions of income received and expenses paid on royalties and licence fees n.i.e. differ from one another. Three-quarters of payments related to royalties and licences are directed to countries with the European Union. The income from them divides equally between EU countries, Asia and America, each of which represents around one-third of the income.
The regional division of construction services and project deliveries is similar. Enterprises in the EU area produce over 90 per cent of construction and project deliveries bought to Finland, while construction and project deliveries of Finnish enterprises are more evenly directed around the world. Exports of construction and project deliveries to Asia decreased by nearly 70 per cent, which in part boosted the share of Europe to nearly 50 per cent of their total exports.
Slightly over one-half of telecommunications, computer and information services are sold outside the EU area. Asia and America account for around one-third of the exports of these services. The services in question are mostly imported from the EU area, the share being nearly 80 per cent of total imports of these services. These services are bought to some extent from Asia and America as well.
Source: Foreign trade in services 2014, Statistics Finland
Inquiries: Pauliina Peltonen 029 551 2585, Risto Sippola 029 551 3383, globalisaatio.tilastot@stat.fi
Director in charge: Mari Ylä-Jarkko
Publication in pdf-format (210.1 kB)
- Tables
-
Tables in databases
Pick the data you need into tables, view the data as graphs, or download the data for your use.
Appendix tables
Updated 25.11.2015
Statistics:
International trade in services [e-publication].
ISSN=1798-3525. 2014. Helsinki: Statistics Finland [referred: 14.2.2026].
Access method: http://stat.fi/til/pul/2014/pul_2014_2015-11-25_tie_001_en.html

