1. Review on offences recorded by the police, customs and border guard
Thefts, frauds and sexual offences on the rise, traffic offences and infractions falling in 2019
1.1. Summary
A total of 818,500 offences and infractions were recorded in 2019 by the police, customs and border guard, which was 6.3 per cent fewer than one year before. Of these offences and infractions, 452,700 were offences against the Criminal Code. Their number increased by 2.1 per cent from the previous year. Most offences outside the Criminal Code consist of traffic infractions, violations of social welfare legislation on road traffic and motor vehicle infractions. Altogether, 334,400 cases of exceeding speed limits were reported, which is 13.5 per cent fewer than in the year before.
Figure 1 Offences against the Criminal Code 1980 to 2019
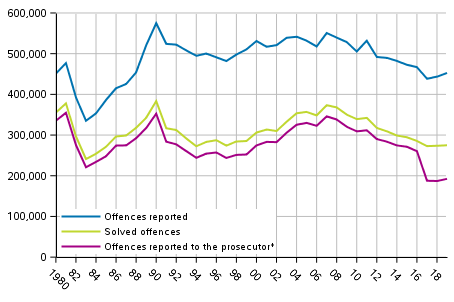
*After 2016 not all of the Traffic offences are reported to prosecutor
Most of the offences and infractions are recorded by the police. The police recorded 805,300 offences and infractions in 2019, which was 6.2 per cent fewer than one year before. Offences against the Criminal Code increased by 2.3 per cent. A total of 444,000 of them were recorded.
The customs recorded 7,900 offences and infractions of which 6,400 were offences against the Criminal Code. The border guard recorded 5,400 offences and infractions of which 2,400 were offences against the Criminal Code. Offences and infractions recorded by the customs decreased by 11.5 per cent and those recorded by the border guard decreased by 8.8 per cent.
During 2019, the police, customs and border guard solved a total of 648,300 offences and infractions, which is 6.7 per cent lower than in 2018. The clearance rate for all offences and infractions fell by 0.3 percentage points.
1.2 Offences against property
Recorded number of offences against property turned upwards
A total of 216,000 offences against property were recorded in 2019, which is 4.4 per cent more than in the previous year.
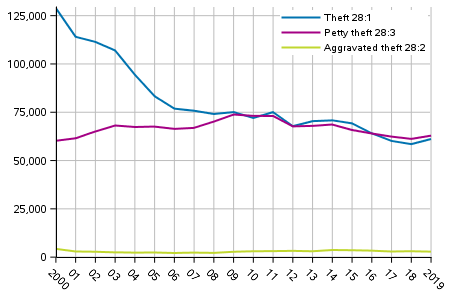
The recorded number of theft offences (Criminal Code, Chapter 28, Sections 1-3) was 126,900, which was good three per cent (4,200 cases) more than in 2018. The number of aggravated thefts (Criminal Code, Chapter 28, Section 2) was 2,800, which is nearly seven per cent lower than in 2018. The number of petty thefts (Criminal Code, Chapter 28, Section 3) grew by nearly three per cent (1,700 cases) and theft offences (Criminal Code, Chapter 28, Section 1) increased by nearly five per cent (2,700 cases) compared with the previous year. In all, 62,900 petty thefts and 61,200 thefts were reported. Compared to the beginning of the twenty-first century, the number of theft offences has fallen by good 30 per cent.
Altogether, 47,700 thefts and petty thefts from shops were recorded, which is 4.6 per cent more than in the year before.
Figure 2. Thefts 2000 to 2019
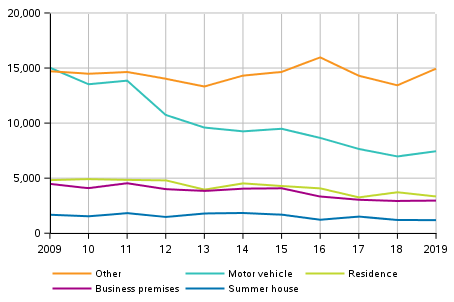
In 2019, the number of reported burglaries (thefts, aggravated thefts or petty thefts through unlawful breaking in) was 29,900, which was 1,600 cases (5.8 per cent) more than in the year before. The number of burglary offences has been falling throughout the 2010s apart for a couple of exceptional years. Break-ins into cars have decreased especially much as their number has almost halved. In 2019, a total of 7,500 break-ins into cars were recorded, which is nearly 500 more than in the previous year.
The number of break-ins into houses reported was 3,300, which is 10 per cent fewer than in the previous year. The number of break-ins into free-time residences recorded was 1,200, which was the same as in 2018. The numbers of these offences vary much yearly but the general trend in the 2010s has been decreasing.
Figure 3. Burglaries 2009 to 2019
In total, 5,700 cases of stealing of a motor vehicle for temporary use (Criminal Code, Chapter 28, Section 9), aggravated stealing of a motor vehicle for temporary use and petty stealing of a motor vehicle for temporary use were recorded, which is good one per cent lower than in the year before.
Table 1. Thefts of use of a motor vehicle 2010-2019
| 2010 | 2011 | 2012 | 2013 | 2014 | 2015 | 2016 | 2017 | 2018 | 2019 | |
| Total | 8,786 | 9,464 | 6,821 | 6,126 | 5,953 | 5,878 | 5,253 | 4,868 | 4,540 | 4,333 |
| Car | 6,045 | 5,996 | 4,335 | 3,645 | 3,511 | 3,712 | 3,253 | 2,937 | 2,893 | 2,758 |
| Moped | 1,770 | 2,116 | 1,631 | 1,560 | 1,524 | 1,240 | 1,088 | 929 | 795 | 776 |
| Motorcycle | 654 | 1,021 | 629 | 656 | 681 | 722 | 694 | 770 | 623 | 562 |
| Boat/vessel | 39 | 32 | 31 | 34 | 19 | 19 | 21 | 34 | 22 | 20 |
| Other motor vehicle | 278 | 299 | 195 | 231 | 218 | 185 | 197 | 198 | 207 | 217 |
Altogether, 1,800 robberies (Criminal Code, Chapter 31, Sections 1-2, 2a) were recorded, which is slightly over six per cent more than in the year before. Of the robberies, 347 were aggravated, which is 44 cases more than in 2018. Nearly two-thirds of robberies occurred in public places.
The number of property offences recorded was 30,500, which was the same as in 2018. Reports of damages to property in public places decreased most. They decreased by close on two per cent. In turn, damages to property committed in a private place increased by good two per cent.
The number of reported frauds (Criminal Code, Chapter 36, Sections 1-3) has been growing for a few years. The number of reported frauds was 28,700, which is 4,200 cases (17 per cent) more than in the previous year. In all, 6,300 means of payment frauds (Criminal Code, Chapter 37, Sections 8-11) were reported, which is nearly 200 cases (three per cent) more than in the previous year.
Examined by region, most offences against property were reported in Uusimaa, both measured in the number of cases and relative to the size of the population. The offences are recorded based on the municipality where the offence occurs, not the municipality of residence of the suspect, so offences committed by tourists and other visitors are visible in the figures for that region.
Table 2. Selected offences against property by region per 100,000 population in 2019
| Offences against property | Theft 28:1 | Aggravated theft 28:2 | Petty theft 28:3 | Breaking into a residence | Breaking into a summer residence | Robberies total | Damages to property total | |
| Whole country | 3,946 | 1,112 | 52 | 1,141 | 61 | 22 | 33 | 553 |
| Uusimaa | 4,827 | 1,509 | 70 | 1,445 | 68 | 10 | 49 | 638 |
| Southwest Finland | 3,652 | 1,051 | 43 | 1,081 | 52 | 15 | 27 | 490 |
| Satakunta | 2,955 | 883 | 45 | 703 | 61 | 23 | 18 | 470 |
| Kanta-H�me | 3,371 | 930 | 54 | 919 | 54 | 32 | 26 | 605 |
| Pirkanmaa | 3,816 | 1,190 | 58 | 1,160 | 73 | 25 | 31 | 575 |
| P�ij�t-H�me | 4,712 | 1,499 | 54 | 1,030 | 66 | 30 | 29 | 599 |
| Kymenlaakso | 3,798 | 887 | 51 | 856 | 63 | 32 | 23 | 518 |
| South Karelia | 4,025 | 801 | 36 | 1,105 | 63 | 16 | 24 | 597 |
| South Savo | 2,849 | 808 | 34 | 745 | 69 | 51 | 15 | 452 |
| North Savo | 3,290 | 849 | 42 | 1,085 | 54 | 28 | 27 | 579 |
| North Karelia | 2,722 | 638 | 19 | 921 | 27 | 12 | 19 | 430 |
| Central Finland | 3,358 | 1,093 | 50 | 921 | 73 | 55 | 29 | 450 |
| South Ostrobothnia | 1,993 | 440 | 29 | 652 | 42 | 25 | 18 | 378 |
| Ostrobothnia | 2,851 | 833 | 47 | 855 | 50 | 24 | 16 | 483 |
| Central Ostrobothnia | 2,433 | 399 | 21 | 1,026 | 38 | 13 | 16 | 398 |
| North Ostrobothnia | 3,456 | 859 | 36 | 1,259 | 53 | 26 | 32 | 490 |
| Kainuu | 3,105 | 517 | 19 | 1,271 | 46 | 25 | 18 | 618 |
| Lapland | 3,110 | 627 | 30 | 900 | 44 | 27 | 23 | 570 |
| �land | 2,192 | 569 | 70 | 612 | 77 | 10 | 10 | 495 |
1.3 Violence and sexual offences
Number of reported sexual offences on the rise in 2019
In all, 72 suspected offences against life were reported. This is 13 cases fewer than in 2018 and the lowest figure in the 2000s. The number of offences against life has primarily been on the decline. Between 2010 to 2019, an average of 91 cases per year have been recorded while between 2000 and 2009 the average was 128. Four out of five offences were committed in private dwellings or some other private location. The number of offences against life in 2015 included 12 murders made with terrorist intent abroad, which the Finnish police were investigating. Of the offences against life recorded in 2017, two were murders made with terrorist intent. Altogether, 329 attempted homicides were recorded, which is 26 cases fewer than in the year before.
In 2018, a total of 33,800 assaults were reported which is 200 cases more than in 2017. In the 2010s, an average of 35,000 assaults have been recorded per year. The number of basic assaults increased by 2.3 per cent. In all, 23,700 such assaults were reported. The number of aggravated assaults went down by 1.6 per cent. A total of 1,600 of them were recorded. The number of petty assaults recorded was 8,600, which is 3.4 per cent fewer than in the previous year. The legislative amendment, which entered into force at the beginning of 2011, considerably increased the number of assault offences recorded in 2011. After the legislative amendment, petty assaults on minors or close relatives became officially prosecutable. In 2011, the number of assault offences recorded was 40,200.
A total of 1,477 rapes (rape, aggravated rape, rape, Paragraph 3) were recorded, which is six per cent more than in the year before. Of all rape offences, nearly 90 per cent were committed in private dwellings or some other private location. The recorded number of sexual abuses of a child was 1,709, which is 24.5 per cent more than in 2018. The number is higher than in 2011 to 2013, when an exceptionally large number of sexual abuses of a child were recorded. The act on aggravated rape of a child entered into force on 15 April 2019. During 2019, a total of 34 cases of aggravated rape of a child were reported. In the statistics, aggravated rape of a child is included in the figures on cases of sexual abuse of a child. In addition, 1,119 other sexual offences were reported. Of them, 518 were cases of sexual harassment, which is six cases more than in 2018. Sexual harassment was added to the Criminal Code on 1 September 2014. The numbers of rapes and sexual abuses of a child vary much yearly. Individual reports may include a series of incidents comprising several criminal acts.
Table 3. Selected violent offences by region per 100,000 population in 2019
| Offences against life and health | Offences against life and attempted | Assault 21:5 | Aggravated assault 21:6 | Petty assault 21:7 | |
| Whole country | 658 | 7 | 431 | 29 | 156 |
| Uusimaa | 722 | 8 | 503 | 25 | 147 |
| Southwest Finland | 601 | 4 | 359 | 25 | 174 |
| Satakunta | 584 | 6 | 342 | 28 | 158 |
| Kanta-H�me | 592 | 10 | 353 | 34 | 155 |
| Pirkanmaa | 624 | 8 | 391 | 27 | 166 |
| P�ij�t-H�me | 582 | 8 | 390 | 25 | 135 |
| Kymenlaakso | 623 | 6 | 393 | 42 | 146 |
| South Karelia | 677 | 5 | 373 | 26 | 236 |
| South Savo | 627 | 6 | 372 | 27 | 191 |
| North Savo | 708 | 18 | 392 | 36 | 237 |
| North Karelia | 494 | 6 | 292 | 27 | 131 |
| Central Finland | 779 | 7 | 551 | 38 | 142 |
| South Ostrobothnia | 543 | 7 | 369 | 26 | 116 |
| Ostrobothnia | 523 | 6 | 329 | 32 | 119 |
| Central Ostrobothnia | 701 | 6 | 475 | 26 | 175 |
| North Ostrobothnia | 568 | 5 | 394 | 31 | 113 |
| Kainuu | 871 | 10 | 604 | 33 | 192 |
| Lapland | 690 | 6 | 437 | 35 | 170 |
| �land | 649 | 10 | 402 | 27 | 167 |
Relative to the population in the region, most sexual offences were reported in Kainuu, 105 cases per 100,000 inhabitants. Most cases of sexual abuse of a child relative to the population were reported in Uusimaa. There a total of 635 sexual abuses of children were reported, that is, 38 cases per hundred thousand inhabitants.
Table 4. Sexual offences by region per 100,000 population in 2019
| Sexual offences | Sexual abuse of a child | Rape | Other sexual offences | |
| Whole country | 78 | 31 | 27 | 20 |
| Uusimaa | 92 | 38 | 30 | 25 |
| Southwest Finland | 59 | 22 | 19 | 18 |
| Satakunta | 70 | 22 | 20 | 28 |
| Kanta-H�me | 52 | 19 | 21 | 12 |
| Pirkanmaa | 79 | 30 | 31 | 19 |
| P�ij�t-H�me | 66 | 26 | 25 | 15 |
| Kymenlaakso | 83 | 31 | 30 | 22 |
| South Karelia | 63 | 29 | 20 | 14 |
| South Savo | 63 | 28 | 21 | 14 |
| North Savo | 63 | 21 | 25 | 18 |
| North Karelia | 61 | 20 | 25 | 17 |
| Central Finland | 81 | 31 | 27 | 23 |
| South Ostrobothnia | 66 | 34 | 17 | 14 |
| Ostrobothnia | 63 | 24 | 20 | 19 |
| Central Ostrobothnia | 57 | 19 | 29 | 9 |
| North Ostrobothnia | 77 | 35 | 26 | 16 |
| Kainuu | 105 | 35 | 53 | 18 |
| Lapland | 65 | 24 | 25 | 16 |
| �land | 94 | 37 | 37 | 20 |
1.4 Traffic offences and infractions
In 2019, a total of 110,600 traffic offences were recorded, which is 4.9 per cent fewer than in the year before. In addition, 351,700 traffic infractions, violations of social welfare legislation on road traffic, and motor vehicle infractions were recorded. Of all traffic offences and infractions, 334,400 were cases of exceeding speed limits. Their number fell by 13.5 per cent from the previous year.
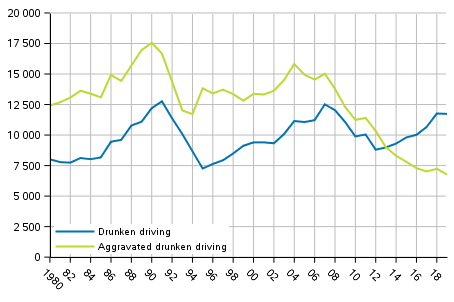
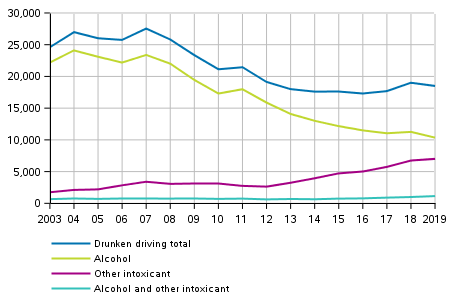
The number of cases of drunken driving decreased after a few years of growth. In 2019, a total of 18,500 cases of drunken driving were recorded, which is 500 cases (2.7 per cent) fewer than in the previous year. Altogether, 11,700 basic drunken driving cases (Criminal Code, Chapter 23, Section 3) were recorded, which is unchanged from the year before. Altogether, 6,800 cases of driving while seriously intoxicated (Criminal Code, Chapter 23, Section 4) were recorded, which is 6.6 per cent fewer than in the year before.
Figure 4. Drunken driving offences in 1980–2019
In cases of driving while seriously intoxicated, alcohol is still the intoxicant in around 90 per cent of cases, but more than one-half of the cases of driving while intoxicated are caused by other narcotic substances.
Figure 5. Drunken driving offences after intoxicant in 2003–2019
Close on 300 waterway, air or rail traffic intoxication cases were recorded, which is approximately 3.8 per cent fewer than in the year before. Forty-three cases of non-motor powered traffic intoxication was recorded.
1.5 Narcotics and alcohol offences
Recorded narcotics offences still growing
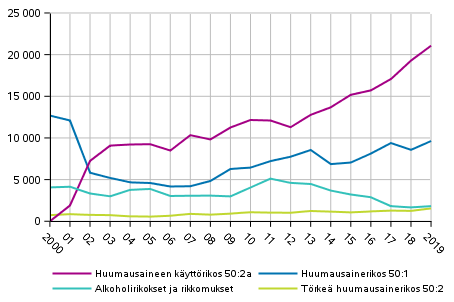
Altogether, 32,300 narcotics offences were recorded, which is 10.9 per cent more than in the year before. A total of 1,550 aggravated narcotics offences were recorded, which is 300 cases more than in the previous year. In total, 21,100 unlawful uses of narcotics were recorded, which is 1,800 cases (9.3 per cent) more than in the previous year.
In all, 1,800 alcohol offences (Criminal Code, Chapter 50a) and infractions were recorded. This was nearly nine per cent higher than in the year before.
Figure 6. Alcohol and narcotics offences in 2000 to 2019
When compiling statistics on offences involving intoxicating substances, offences comprising several criminal acts are entered as one. Offences involving intoxicating substances are such that they are generally found out only because of the activity of the police, customs or border guard officials and most of the offences remain undisclosed.
1.6 Other offences and infractions
Altogether 4,700 reports of invasion of domestic premises and harassing communications (Criminal Code, Chapter 24, Sections 1-2) were recorded, which is 150 fewer cases than one year earlier. In all, 87 cases of invasion or aggravated invasion of public premises (Criminal Code, Chapter 24, Sections 3-4) were recorded. Illicit observation was reported 420 times, which is 150 cases more than in the previous year.
In all, 9,300 menaces, 4,600 defamations, and close on 700 stalking cases were recorded. The number of menaces grew by 5.1 per cent and that of defamations by 3.8 per cent.
In all, 3,900 identity thefts were recorded, which is 3.1 per cent more than in the previous year.
Good 300 employment offences (Criminal Code, Chapter 37) were reported, which is nearly 50 cases fewer than in the year before. Nearly 500 environmental offences (Criminal Code, Chapter 48) were recorded, which is approximately 50 cases fewer than in the year before.
1.7 Solving of offences
During 2019, the police, customs and border guard solved a total of 648,300 offences and infractions, which is 6.7 per cent lower than in 2018. The fall was mainly caused by a fall in the number of traffic offences and infractions. Altogether 275,000 offences against the Criminal Code were solved, which is good 1,300 cases more than in the previous year. The clearance rate of all offences and infractions was 79.2 per cent and the clearance rate of offences against the Criminal Code was 60.7 per cent. The corresponding rates were 79.5 and 61.7 per cent in the year before. The clearance rate is calculated as the share of solved offences in the statistical year compared to the number of reported offences in the statistical year. For this reason, the clearance rate may be over 100 per cent for some year.
The clearance rate varies by type of offence quite strongly. Only approximately 15 per cent of thefts (Criminal Code, Chapter 28, Section 1) are solved while one-half of petty theft (Criminal Code, Chapter 28, Section 3) cases are solved. The clearance rates of assault offences have decreased slightly in recent years. In 2019, the clearance rate of assault offences was 63 per cent having been 70 per cent in 2015. Due to the manner of disclosure, drunken driving and traffic offences, and offences involving intoxicating substances almost all become solved.
In 2018, a large number of sexual abuses of a child and rapes were recorded towards the end of the year, so they could not be cleared during that same year. This is visible in the drop of the clearance rate of such offences in 2018. In 2019, the clearance rate of these offences rose again closer to the figures for 2017.
Table 5. Clearance rate of certain types of offences in 1986-2019
| 1986 - 1990 | 1991 - 1995 | 1996 - 2000 | 2001 - 2005 | 2006 - 2010 | 2011 - 2015 | 2016 | 2017 | 2018 | 2019 | |
| Offences against the Criminal Code | 69 | 58 | 57 | 63 | 67 | 63 | 61 | 62 | 62 | 61 |
| Theft 28:1 | 25 | 17 | 14 | 15 | 18 | 15 | 15 | 15 | 14 | 14 |
| Aggravated theft 28:2 | 39 | 29 | 40 | 41 | 38 | 34 | 32 | 37 | 31 | 31 |
| Petty theft 28:3 | 78 | 70 | 67 | 58 | 57 | 56 | 54 | 50 | 51 | 52 |
| Robberies total | 53 | 43 | 42 | 45 | 49 | 53 | 53 | 56 | 53 | 54 |
| Damages to property total | 29 | 27 | 27 | 26 | 25 | 22 | 22 | 22 | 24 | 23 |
| Attempted manslaughter, murder or killing | 95 | 91 | 92 | 94 | 97 | 92 | 88 | 100 | 84 | 86 |
| Assault 21:5 | 79 | 74 | 76 | 80 | 81 | 76 | 67 | 66 | 64 | 64 |
| Aggravated assault 21:6 | 85 | 84 | 83 | 87 | 88 | 84 | 81 | 80 | 77 | 78 |
| Petty assault 21:7 | 95 | 86 | 79 | 75 | 73 | 72 | 65 | 60 | 59 | 58 |
| Sexual abuse of a child | 91 | 84 | 88 | 82 | 86 | 75 | 69 | 63 | 52 | 59 |
| Rape | 63 | 56 | 57 | 63 | 66 | 70 | 67 | 71 | 55 | 68 |
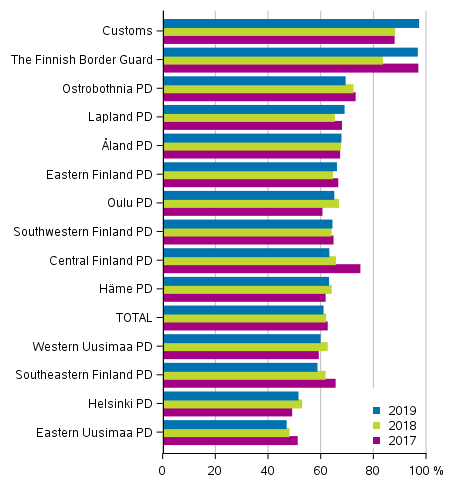
The lowest clearance rates for offences against the Criminal Code were found in the Eastern Uusimaa and Helsinki police departments. On the other hand, most offences were reported to the Helsinki police department, 73,000 cases. This is some 11,000 more than to the Central Finland police department, which recorded the second most offences.
Figure 7. Clearance rate of offences against the Criminal Code after authorities 2017 to 2019
Source: Statistics on offences and coercive measures 2019, Offences reported. Statistics Finland
Inquiries: Kimmo Haapakangas 029 551 3252, rikos@stat.fi
Director in charge: Jari Tarkoma
Updated 14.5.2020
Official Statistics of Finland (OSF):
Statistics on offences and coercive measures [e-publication].
ISSN=2342-9178. 13 2019,
1. Review on offences recorded by the police, customs and border guard
. Helsinki: Statistics Finland [referred: 23.2.2026].
Access method: http://stat.fi/til/rpk/2019/13/rpk_2019_13_2020-05-14_kat_001_en.html

