Published: 18 October 2007
Production of electricity went up by 16 per cent in 2006
According to Statistics Finland's statistics on production of electricity and heat, electricity produced in Finland amounted to 78.6 terawatt hours (TWh) or billion kilowatt hours (kWh) in 2006. The volume of electricity produced was 16 per cent higher than one year previously. District heat production totalled 33.6 TWh and increased by 3 per cent. In 2006, industrial heat production totalled of 63.3 TWh, which was 12 per cent more than in the year before.
In 2006, production of electricity went up almost to the level of 2004. In 2005, exceptionally large volumes of electricity were imported and relatively small volumes of electricity were produced in Finland. In 2006, water resources were scarcer than usual in the Nordic countries, which made it necessary to increase production of electricity in Finland. Thus, Finland became a net exporter of electricity on the Nordic market in 2006. The production of hydro power diminished by 17 per cent in Finland. The production of condensate power more than tripled. The volume of electricity generated in combined heat and power production grew by 5 per cent but that generated with nuclear power diminished by 2 per cent. Less wind power was also produced than in the previous years, in 2006 the reduction amounted to 9 per cent.
The demand for heating energy remained roughly on level with the previous year. The years 2005 and 2006 were both warmer than average. However, the production of district heat grew by roughly 3 per cent in 2006 and that of industrial heat by as much as 12 per cent, because an exceptionally low volume of its was produced in 2005 due to, among other things, an industrial dispute in the forest industry.
Production of electricity and heat by production mode in 2006
| Electricity | District heat | Industrial heat | Total fuels used1) | ||
| TWh | TWh | TWh | PJ | ||
| Separate production of electricity | |||||
| Hydro power | 11.3 | - | - | - | |
| Wind power | 0.2 | - | - | - | |
| Nuclear power | 22.0 | - | - | - | |
| Condensate power2) | 17.6 | - | - | 170.7 | |
| Total | 51.0 | - | - | 170.7 | |
| Combined heat and power production | 27.6 |
25.9 |
50.3 |
461.9 |
|
| Separate heat production | - | 7.7 | 13.0 | 84.5 | |
| Total | 78.6 | 33.6 | 63.3 | 717.0 | |
1) In calculating total primary energy
used, hydro power and wind power are made commensurate with
fuels according to directly obtained electricity (3.6
PJ/TWh).
Total nuclear energy used is calculated at the efficiency ratio of
33 per cent from
produced nuclear power (10.91 PJ/TWh).
2) Condensate power refers to separate production of electricity with fuels. It includes both the electricity produced at condensing power plants and the condensate electricity produced at energy and heat generation plants.
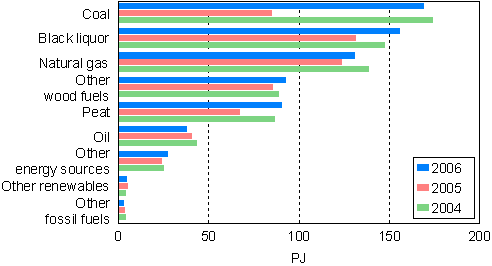
The use of fuels in the production of electricity and heat went up by 26 per cent and the use of coal almost doubled in 2006. The use of peat increased by 35 per cent and that of black liquor from the forest industry by 18 per cent. The use of other fossil fuels fell by 13 per cent and that of other renewable fuels by 10 per cent. The largest group of other fuels is recycled fuels. The use of recovered fuels decreased, as the EU's Waste Incineration Directive entered into force at the beginning of 2006, as regards old incineration plants.
Use of fuels in production of electricity and heat 2004-2006

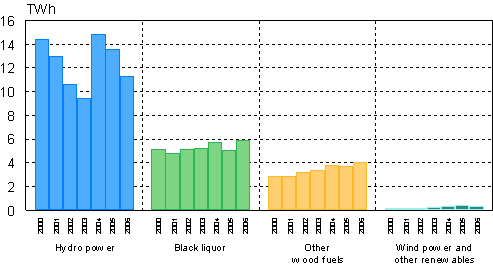
Due to the reduced amounts of produced hydro power, the volume of electricity produced with renewable energy sources has diminished in recent years. In 2006, the volume contracted by five per cent from the year before. However, the volume of electricity produced with black liquor from the forest industry increased by 17 per cent that produced with other wood-based fuels by 11 per cent from the previous year.
Electricity produced with renewable energy sources 2000-2006

Source: Statistics on production of electricity and heat, Statistics Finland
Inquiries: Ms Minna Niininen +358 9 1734 3549, energia@stat.fi
Director in charge: Ms Kaija Hovi
Links: Statistics Finland's Energy production inquiry
- Reviews
-
- Production of electricity and heat in 2006 (18.10.2007)
- Tables
-
Tables in databases
Pick the data you need into tables, view the data as graphs, or download the data for your use.
Appendix tables
- Figures
-
- Figure 01. Electricity production by production mode 2006 (18.10.2007)
- Figure 02. Electricity production by production mode 2004-2006 (18.10.2007)
- Figure 03. Electricity production by production mode 2000-2006 (18.10.2007)
- Figure 04. Electricity production by energy sources 2000-2006 (18.10.2007)
- Figure 05. Electricity production by energy type 2000-2006 (18.10.2007)
- Figure 06. Electricity produced with renewable energy sources 2000-2006 (18.10.2007)
- Figure 07. Electricity produced with renewable energy sources 2000-2006 (18.10.2007)
- Figure 08. Production of district and industrial heat 2006 (18.10.2007)
- Figure 09. Production of district heat by fuels 2004-2006 (18.10.2007)
- Figure 10. Production of industrial heat by fuels 2004-2006 (18.10.2007)
- Figure 11. Use of fuels by production mode in production of electricity and heat 2006 (18.10.2007)
- Figure 12. Use of fuels in electricity and heat production 2004-2006 (18.10.2007)
- Figure 13. Use of fuels in combined heat and power production 2004-2006 (18.10.2007)
- Figure 14. Use of fuels in separate production of electricity 2004-2006 (18.10.2007)
- Figure 15. Use of fuels in separate production of heat 2004-2006 (18.10.2007)
Last updated 18.10.2007
Official Statistics of Finland (OSF):
Production of electricity and heat [e-publication].
ISSN=1798-5099. 2006. Helsinki: Statistics Finland [referred: 18.2.2026].
Access method: http://stat.fi/til/salatuo/2006/salatuo_2006_2007-10-18_tie_001_en.html

