

Published: 4 January 2013
The profit share of non-financial corporations decreased in the third quarter
In the third quarter of 2012, the key indicators for the household and non-financial corporation sectors were mainly in a slight decline. The profit share of the non-financial corporation sector was a bit lower than last year. The investment rate of both households and enterprises decreased somewhat. Household adjusted disposable income increased nominally thanks to the growth in wages and salaries and received social benefits. These data derive from Statistics Finland’s quarterly sector accounts.
Key indicators for households and non-financial corporations
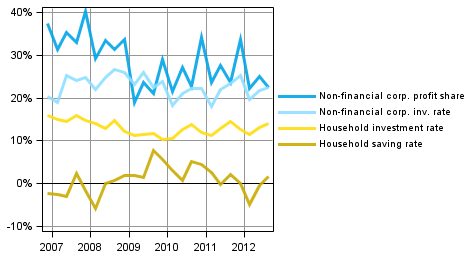
Households' saving rate was 1.7 per cent in the third quarter of 2012. One year previously, the figure was 2.3 per cent. Saving rate refers to the proportion of savings in disposable income. In the third quarter, the investment rate of households accounted for 14.2 per cent of disposable income. One year previously, the corresponding figure was 14.6 per cent. Most of households' investments were investments in dwellings.
Household adjusted disposable income, the indicator recommended by the OECD for measuring economic well-being, grew in nominal terms by 2.7 per cent from the corresponding quarter of last year. Adjusted disposable income is derived by adding services produced by the public sector, such as education, health and social services, to the disposable income of the household sector.
In the third quarter of 2012, the profit share of non-financial corporations, or the share of profits in value added, was 22.5 per cent. One year previously, the corresponding figure was 23.7 per cent. The investment rate of non-financial corporations, or the proportion of investments in value added, was 22.6 per cent in the third quarter of 2012. One year ago, the investment rate was slightly higher, 23.4 per cent.
Sector accounts only contain figures at current prices. Profit share, saving rate and investment rate are calculated from net figures. Households do not include non-profit institutions serving households.
Source: Sector accounts, Statistics Finland
Inquiries: Jesse Vuorinen 09 1734 3363, Erkki L��k�ri 09 1734 3355, skt.95@stat.fi
Director in charge: Leena Storg�rds
Publication in pdf-format (514.1 kB)
- Reviews
- Tables
-
Tables in databases
Pick the data you need into tables, view the data as graphs, or download the data for your use.
Appendix tables
- Figures
-
- Appendix figure 1. Key indicators (4.1.2013)
- Appendix figure 2. Non-financial corporations' indicators (4.1.2013)
- Appendix figure 3. Financial corporations' interest income and interest expenses (4.1.2013)
- Appendix figure 4. Households' indicators (4.1.2013)
- Appendix figure 5. Components of general government sector net lending (4.1.2013)
- Appendix figure 6. Components of household sector adjusted disposable income (4.1.2013)
- Appendix figure 7. Components of the balance of goods and services in foreign trade (from the perspective of the rest-of-the-world sector) (4.1.2013)
- Appendix figure 8. Components of the current account balance in foreign trade (from the perspective of the rest of the world sector) (4.1.2013)
Updated 4.1.2013
Official Statistics of Finland (OSF):
Quarterly sector accounts [e-publication].
ISSN=2243-4992. 3rd quarter 2012. Helsinki: Statistics Finland [referred: 2.8.2026].
Access method: http://stat.fi/til/sekn/2012/03/sekn_2012_03_2013-01-04_tie_001_en.html