

Published: 30 September 2013
Households' saving rate growing in the second quarter of 2013
Households' saving rate grew seasonally adjusted from the previous quarter. The saving rate grew more than consumption as income increased. The saving rate has mostly been growing for several years. The profit share of non-financial corporations did not change from the previous quarter and their investment rate in turn fell. Adjusted disposable income describing households' economic well-being grew slightly after a break of over one year also when adjusted for price changes. These data derive from Statistics Finland’s quarterly sector accounts. Seasonally adjusted series and trend series are now published from it for the first time.
Key indicators for households and non-financial corporations, seasonally adjusted
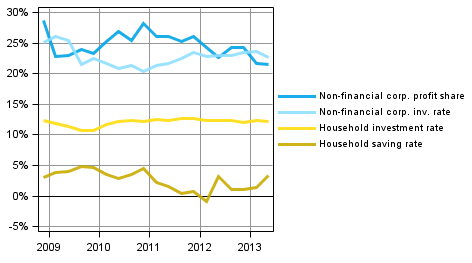
In the second quarter of 2013, the profit share of non-financial corporations, or the share of profits in value added, was unchanged from the previous quarter, i.e. 21.6 per cent. The investment rate of non-financial corporations, or the proportion of investments in value added, fell from the previous quarter's 23.7 to 22.7 per cent. The key figures were calculated from seasonally adjusted time series.
Households' saving rate was 3.3 per cent in the second quarter of 2013. In the previous quarter, the figure was 1.4 per cent. Saving rate refers to the proportion of savings in disposable income. In the second quarter, the investment rate of households accounted for 12.1 per cent of disposable income. In the previous quarter, the corresponding figure was 12.3 per cent. Most of households' investments were investments in dwellings.
Household adjusted disposable income grew in real terms by 1.3 per cent from the respective quarter of the year before. Adjusted income is the indicator recommended by the OECD for measuring the economic well-being of households. Adjusted disposable income is derived by adding individual services produced by the public sector, such as education, health and social services, to the disposable income of the household sector.
Sector accounts are calculated only at current prices. However, a volume indicator describing the development adjusted for price changes is calculated for household adjusted disposable income in a separate Appendix Table. The profit share, saving rate and investment rate are calculated from net figures. Households do not include non-profit institutions serving households.
Source: Sector accounts, Statistics Finland
Inquiries: Jesse Vuorinen 09 1734 3363, Katri Soinne 09 1734 2778, skt.95@stat.fi
Director in charge: Leena Storg�rds
Publication in pdf-format (446.4 kB)
- Reviews
- Tables
-
Tables in databases
Pick the data you need into tables, view the data as graphs, or download the data for your use.
Appendix tables
- Figures
- Revisions in these statistics
-
- Revisions in these statistics (30.9.2013)
Updated 30.9.2013
Official Statistics of Finland (OSF):
Quarterly sector accounts [e-publication].
ISSN=2243-4992. 2nd quarter 2013. Helsinki: Statistics Finland [referred: 25.7.2026].
Access method: http://stat.fi/til/sekn/2013/02/sekn_2013_02_2013-09-30_tie_001_en.html