This set of statistics has been discontinued.
New data are no longer produced from the statistics.
Published: 12 October 2018
Investment service companies’ commission income decreased in the second quarter of 2018
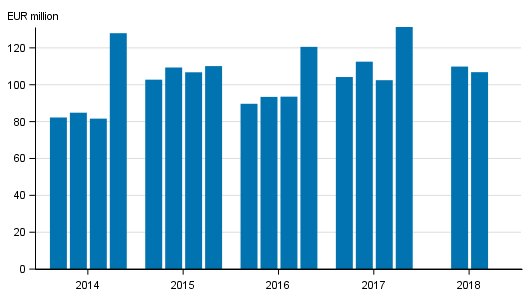
The net operating profit of investment service companies was EUR 36 million in the second quarter of 2018. Some EUR five million less operating profit was accumulated than in the corresponding quarter last year. Commission income fell by EUR six million to EUR 107 million from one year back. These data derive from Statistics Finland’s statistics on investment service companies.
Investment service companies’ operating profit by quarter in 2014 to 2018, EUR million

Investment service companies offer their customers services related to investment services such as investment advisory services, asset management, and reception, intermediation and implementation of trading assignments in monetary instruments. Commission income and expenses are the main items related to investment service companies’ income and expenses in the profit and loss account. In addition to commission income and expenses, operating profit is considerably affected by administrative expenses. In some cases, other items, such as profit or loss from non-current assets classified as held for sale can have a major impact on profit for the financial period.
Commission income and expenses
Commission income totalled EUR 107 million in the second quarter of 2018. The decrease compared to the corresponding period of last year amounted to EUR six million, or 5.1 per cent. Compared to the previous quarter, EUR three million less commission income was accumulated. In turn, commission expenses amounted to EUR 24 million, which is EUR four million, or 13.4 per cent less than one year previously. Compared with the previous quarter, there were EUR six million less commission expenses.
Administrative expenses
In the second quarter of 2018, investment service companies had EUR 48 million in administrative expenses, which was EUR two million more than in the year before and EUR one million more than in the previous quarter. Personnel expenses amounted to EUR 28 million, or some 59 per cent of administrative expenses. Personnel expenses rose by EUR two million from the previous year’s corresponding quarter. Other administrative expenses were in turn EUR 19 million.
Balance sheets
At the end of the second quarter of 2018, the aggregate value of the balance sheets was EUR 338 million. The balance sheets decreased by 5.7 per cent year-on-year. The share of own equity of the balance sheet total rose from 62.5 to around 65.6 per cent. Due to investment service companies’ renewed FINREP reporting practices, the balance sheet items are not in all respects fully comparable between 2018 and earlier years.
At the end of the second quarter of 2018, there were 62 investment service companies operating in Finland, 44 of which generated a positive operating result.
Source: Investment firms, Statistics Finland
Inquiries: Antti Suutari 029 551 3257, Jarkko Kaunisto 029 551 3551
Director in charge: Ville Vertanen
Publication in pdf-format (241.4 kB)
- Tables
-
Tables in databases
Pick the data you need into tables, view the data as graphs, or download the data for your use.
Appendix tables
- Figures
Updated 12.10.2018
Official Statistics of Finland (OSF):
Investment service companies [e-publication].
ISSN=2342-5202. 2nd quarter 2018. Helsinki: Statistics Finland [referred: 19.2.2026].
Access method: http://stat.fi/til/spy/2018/02/spy_2018_02_2018-10-12_tie_001_en.html

