Published: 13 April 2012
Birth rate fell slightly
Corrected on 4 May 2012. The correction is
indicated in red. Was previously more.
According to Statistics Finland's data on population changes, the
birth rate fell slightly from the previous year, and at the same
time ended its slight rising that had started in 2007. At the
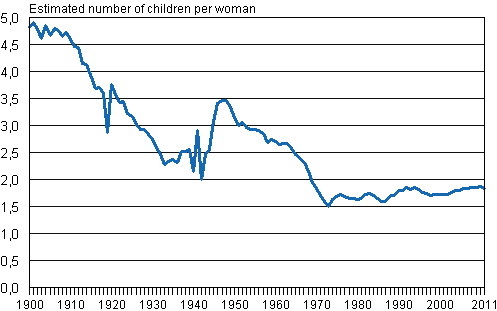
fertility rate prevailing in 2011, a woman would give birth to an
average of 1.83 children during her reproductive period. Since
1969, the birth rate has been below the threshold on population's
renewal, which is approximately 2.1 children per woman.
Total fertility rate 1900–2011

The number of births just failed to reach 60,000 and was 59,961 children. In 2011, 1,019 fewer children were born than in the year before. Examined by the age of mother, the number of women aged under 34 at confinement was clearly lower than one year earlier. For this reason, there were especially fewer first-time mothers but also fewer women having given birth to their second child than in the previous year. On the other hand, the number of third-time mothers was slightly higher than in the year before, which counterbalanced the fallen number of births.
On the average, the women who gave birth in 2011 were slightly older than one year earlier. The mean age of all women at confinement rose by two decimals and was 30.3 years. By contrast, the mean age at first confinement only rose by one decimal to 28.4 years. During the 2000s, the mean age at first confinement has risen by 0.8 years.
Measured with the total fertility rate, the birth rate was above the rate for the whole country in 13 regions in 2011. The Ostrobothnian regions had the highest relative numbers of births: 2.37 in Central Ostrobothnia, 2.33 in North Ostrobothnia and 2.17 in South Ostrobothnia. The birth rate exceeded the threshold on population's renewal in only these three regions. The lowest average birth rate of 1.65 was recorded in the region of Uusimaa.
Number of live births, total fertility rate and mother's mean age by live births in 2002–2011
| Year | 2002 | 2003 | 2004 | 2005 | 2006 | 2007 | 2008 | 2009 | 2010 | 2011 |
| Number of live births | 55 555 | 56 630 | 57 758 | 57 745 | 58 840 | 58 729 | 59 530 | 60 430 | 60 980 | 59 961 |
| Total fertility rate | 1,72 | 1,76 | 1,80 | 1,80 | 1,84 | 1,83 | 1,85 | 1,86 | 1,87 | 1,83 |
| Mother's mean age by all live births | 29,9 | 30,0 | 30,0 | 30,0 | 30,0 | 30,0 | 30,1 | 30,1 | 30,1 | 30,3 |
| Mother's mean age by first live birth | 27,7 | 27,9 | 27,8 | 27,9 | 28,0 | 28,1 | 28,2 | 28,2 | 28,3 | 28,4 |
Source: Population and Cause of Death Statistics. Statistics Finland
Inquiries: Timo Nikander (09) 1734 3250, vaesto.tilasto@stat.fi
Director in charge: Jari Tarkoma
Publication in pdf-format (330.3 kB)
- Tables
-
Tables in databases
Pick the data you need into tables, view the data as graphs, or download the data for your use.
Appendix tables
- Figures
- Quality descriptions
-
- Quality description, births 2011 (13.4.2012)
Updated 13.4.2012
Official Statistics of Finland (OSF):
Births [e-publication].
ISSN=1798-2413. 2011. Helsinki: Statistics Finland [referred: 7.2.2026].
Access method: http://stat.fi/til/synt/2011/synt_2011_2012-04-13_tie_001_en.html

