Published: 12 April 2013
Birth rate continued decreasing slowly
According to Statistics Finland's data on population changes, the
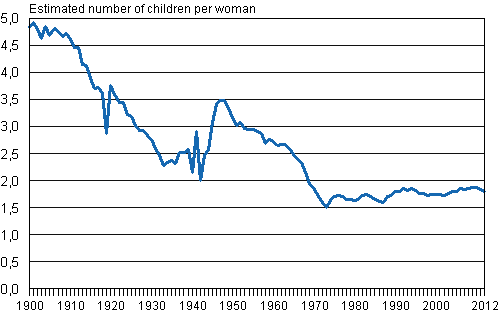
birth rate decreased for the second year in a row. At the fertility
rate prevailing in 2012, a woman would give birth to an average of
1.80 children. Since 1969, the birth rate has been below the
threshold on population's renewal, which is approximately 2.1
children per woman.
Total fertility rate 1900–2012

The number of births fell slightly from the previous year. In 2012, 59,493 children were born, which was 468 less than in the year before. Examined by the age of the mother, the birth rate decreased a little in all age groups under the age of 36, but most clearly for women in their 30s.
Women become mothers at ever later age. The mean age at first confinement rose by one decimal to 28.5 years in 2012. During the 2000s, the mean age at first confinement has risen by 0.9 years. The mean age of all women at confinement remained unchanged at 30.3 years.
Measured with the total fertility rate, the birth rate was above the rate for the whole country in 15 regions in 2012. The Ostrobothnian regions had the highest relative numbers of births: On average 2.37 children per woman in North Ostrobothnia, 2.26 in Central Ostrobothnia and 2.20 in South Ostro-bothnia. The birth rate exceeded the threshold on population's renewal in only these three regions. The lowest average birth rate of 1.60 was recorded in the region of Uusimaa.
In Finland's largest cities, the highest birth rate is in Oulu, where the total fertility rate was 2.06 in the five year period of 2008-2012. The second highest rates were found in Espoo, 1.95 and Vantaa, 1.90. Respectively, the lowest birth rate was found in Helsinki, where the total fertility rate was 1.36. The rate was 1.41 in Turku and 1.52 in Tampere.
Number of live births, total fertility rate and mother's mean age by live births in 2003–2012
| Year | 2003 | 2004 | 2005 | 2006 | 2007 | 2008 | 2009 | 2010 | 2011 | 2012 |
| Number of live births | 56 630 | 57 758 | 57 745 | 58 840 | 58 729 | 59 530 | 60 430 | 60 980 | 59 961 | 59 493 |
| Total fertility rate | 1,76 | 1,80 | 1,80 | 1,84 | 1,83 | 1,85 | 1,86 | 1,87 | 1,83 | 1,80 |
| Mother's mean age by all live births | 30,0 | 30,0 | 30,0 | 30,0 | 30,0 | 30,1 | 30,1 | 30,1 | 30,3 | 30,3 |
| Mother's mean age by first live birth | 27,9 | 27,8 | 27,9 | 28,0 | 28,1 | 28,2 | 28,2 | 28,3 | 28,4 | 28,5 |
Source: Population and Cause of Death Statistics. Statistics Finland
Inquiries: Timo Nikander (09) 1734 3250, vaesto.tilasto@stat.fi
Director in charge: Riitta Harala
Publication in pdf-format (297.9 kB)
- Tables
-
Tables in databases
Pick the data you need into tables, view the data as graphs, or download the data for your use.
Appendix tables
- Figures
- Quality descriptions
-
- Quality description, births 2012 (12.4.2013)
Updated 12.4.2013
Official Statistics of Finland (OSF):
Births [e-publication].
ISSN=1798-2413. 2012. Helsinki: Statistics Finland [referred: 17.2.2026].
Access method: http://stat.fi/til/synt/2012/synt_2012_2013-04-12_tie_001_en.html

