

Published: 11 June 2010
New orders in manufacturing grew by 22,1 per cent year-on-year in April
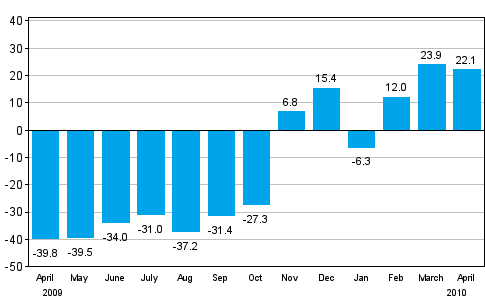
According to Statistics Finland, the value of new orders in manufacturing was 22.1 per cent higher in April 2010 than twelve months earlier. In the January to April period, new orders in manufacturing increased by 12.6 per cent year-on-year.
Change in new orders in manufacturing from corresponding month of the previous year (original series), % (TOL 2008)
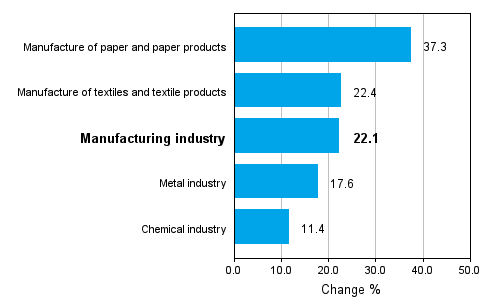
Strong growth of new orders in manufacturing continued in April when growth was recorded in all the examined industries. The value of new orders went up most briskly in the manufacture of paper, and paper and board products where the increase amounted to as much as 37.3 per cent. However, the growth is partly explained by the strike in stevedoring in March in consequence of which an exceptionally large number of new orders accumulated into April.
In the textile industry orders went up by 22.4 per cent and in the metal industry by 17.6 per cent. However, especially in the metal industry the value of orders is still fairly low and the growth figure is partially explained by the weaker than usual situation in the comparison year. The value of orders in the chemical industry rose by 11.4 per cent.
These statistics should be examined bearing in mind that they typically show strong monthly fluctuations because even new orders of high value are not examined over extended time periods but for the statistical reference month only.
Change in new orders in manufacturing 04/2009-04/2010 (TOL 2008)
The index of new orders in manufacturing describes development in the value of new orders received by enterprises for commodities and services that are meant to be produced by establishments located in Finland. These statistics are based on non-probability sampling, in which the basic observation unit is an enterprise or a kind-of-activity unit. The sample comprises monthly approximately 400 to 430 enterprises or their kind-of-activity units. Index point figures and annual change percentages are published monthly for five industry categories. The time series start from January 2005 and their base year is 2005 (2005=100). A detailed description of the statistics and the calculation method are included in the quality description on the home page of the statistics.
Source: New orders in manufacturing 2010, April. Statistics Finland
Inquiries: Jukka Appelqvist (09) 1734 3391, volyymi.indeksi@stat.fi
Director in charge: Hannele Orjala
Updated 11.6.2010
Statistics:
New orders in manufacturing [e-publication].
ISSN=1798-6737. April 2010. Helsinki: Statistics Finland [referred: 14.7.2026].
Access method: http://stat.fi/til/teul/2010/04/teul_2010_04_2010-06-11_tie_001_en.html