

Published: 10 December 2012
New orders in manufacturing grew by 9.1 per cent year-on-year in October
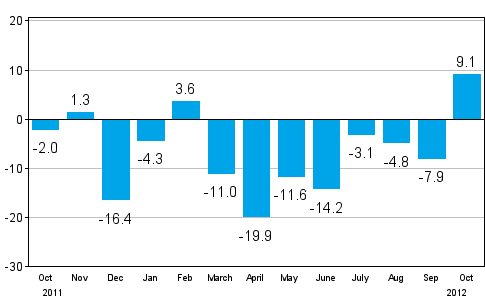
The decrease in new orders in manufacturing, which has continued for over six months, halted in October 2012, when according to Statistics Finland, the value of new orders was 9.1 per cent higher than one year previously. In the January to October period, new orders decreased by 7.1 per cent year-on-year.
Change in new orders in manufacturing from corresponding month of the previous year (original series), % (TOL 2008)
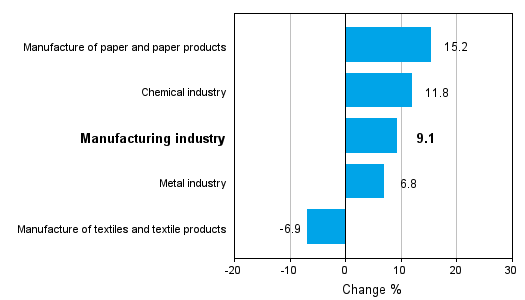
Among the examined main industries, orders grew by 15.2 per cent in the manufacture of paper, and paper and board products, by 11.8 per cent in the chemical industry and by 6.8 per cent in the metal industry. In contrast, in the textile industry orders decreased by 6.9 per cent compared with last year's October.
When interpreting these statistics it should be borne in mind that they typically show strong fluctuations by month. Even new orders of substantial value are not examined over extended time periods but for the statistical reference month only.
Change in new orders in manufacturing 10/2011-10/2012 (TOL 2008)
The statistics on new orders in manufacturing will utilise the base year 2010=100 starting from the data concerning January 2013. The data will be released for the first time with the new base year on 8 March 2013.
The index of new orders in manufacturing describes development in the value of new orders received by enterprises for commodities and services that are meant to be produced by establishments located in Finland. These statistics are based on non-probability sampling, in which the basic observation unit is an enterprise or a kind-of-activity unit. The sample comprises monthly approximately 400 to 430 enterprises or their kind-of-activity units. Index point figures and annual change percentages are published monthly for five industry categories. The time series start from January 2005 and their base year is 2005 (2005=100). A detailed description of the statistics and the calculation method are included in the quality description on the home page of the statistics.
Source: New orders in manufacturing 2012, October. Statistics Finland
Inquiries: Eetu Toivanen 09 1734 3331, Kari Rautio 09 1734 2479, volyymi.indeksi@stat.fi
Director in charge: Hannele Orjala
Publication in pdf-format (245.4 kB)
Updated 10.12.2012
Statistics:
New orders in manufacturing [e-publication].
ISSN=1798-6737. October 2012. Helsinki: Statistics Finland [referred: 14.7.2026].
Access method: http://stat.fi/til/teul/2012/10/teul_2012_10_2012-12-10_tie_001_en.html