

Published: 9 February 2018
New orders in manufacturing fell by 4.3 per cent year-on-year in December
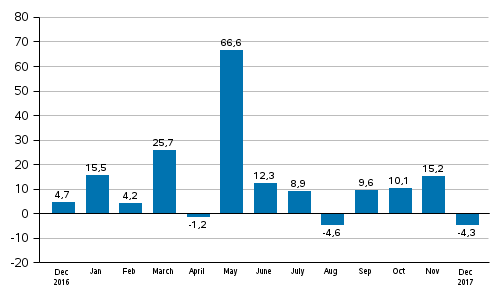
According to Statistics Finland, the value of new orders in manufacturing was 4.3 per cent lower in December 2017 than twelve months earlier. During 2017, orders rose by 12.8 per cent year-on-year.
Annual change in new orders in manufacturing (original series), % (TOL2008)
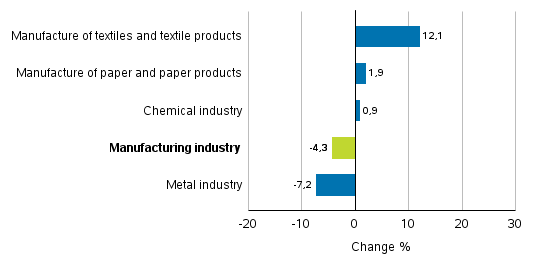
In December, enterprises received more new orders than twelve months ago in the textile industry, in the manufacture of paper and paper board products and in the chemical industry. Orders increased by 12.1 per cent in the textile industry, by 1.9 per cent in paper industry and by 0.9 per cent in the chemical industry from the year before. In the metal industry, new orders decreased by 7.2 per cent year-on-year.
When interpreting these statistics, it should be borne in mind that they typically show strong fluctuations by month. Even new orders of substantial value are not examined over extended time periods but for the statistical reference month only.
Change in new orders in manufacturing 12/2016– 12/2017
The statistics on new orders in manufacturing will utilise the base year 2015=100 starting from the data concerning January 2018. The data will be released for the first time with the new base year on 9 March 2018.
The index of new orders in manufacturing describes development in the value of new orders received by enterprises for commodities and services that are meant to be produced by establishments located in Finland. These statistics are based on non-probability sampling, in which the basic observation unit is an enterprise or a kind-of-activity unit. The sample comprises monthly 400 to 450 enterprises or their kind-of-activity units. Index point figures and annual change percentages are published monthly for five industry categories. The time series start from January 2005 and their base year is 2010 (2010=100). The index figures may become slightly revised as new data accumulate and enterprises report changes to their data. Due to supplementations, the latest 12 months are revised in the releases. A detailed description of the statistics and the calculation method are included in the quality description on the home page of the statistics.
Source: New orders in manufacturing 2017, December. Statistics Finland
Inquiries: Jussi Haavisto 029 551 3341, Maarit M�kel� 029 551 3324, volyymi.indeksi@stat.fi
Director in charge: Sami Saarikivi
Publication in pdf-format (252.5 kB)
Updated 9.2.2018
Statistics:
New orders in manufacturing [e-publication].
ISSN=1798-6737. December 2017. Helsinki: Statistics Finland [referred: 3.8.2026].
Access method: http://stat.fi/til/teul/2017/12/teul_2017_12_2018-02-09_tie_001_en.html