Published: 2 March 2018
One-third of persons at-risk-of-poverty are young adults
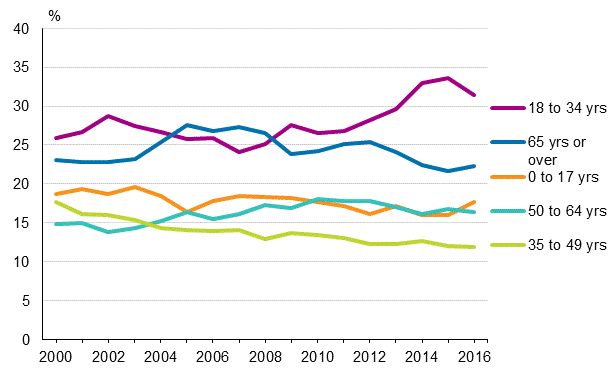
The share of persons aged 18 to 34 among those at-risk-of-poverty has grown clearly in recent years according to Statistics Finland's income distribution statistics. Around one-quarter of persons at-risk-of-poverty were young adults in 2007 but the share has increased to around one-third by 2016. The share persons aged 35 to 49 among those at-risk-of-poverty has declined evenly throughout the 2000s. The share of persons aged 65 years or older among those below the risk-of-poverty threshold has also declined, and slightly over one-fifth of those at-risk-of-poverty were in this age group in 2016.
Age structure of persons at-risk-of-poverty in 2000 to 2016

In 2016, there were 623,000 persons at-risk-of-poverty, which is 11.5 per cent of the household population. In 2016, altogether 196,000 persons at-risk-of-poverty were aged 18 to 34. Of them, 58 per cent were students. In all, 74,000 persons aged 35 to 49 were at-risk-of-poverty and around 40 per cent of them were unemployed. Persons at-risk-of-poverty aged 65 or over numbered around 140,000 of whom nearly all were pensioners. Persons at-risk-of-poverty are more often than earlier students, unemployed and other non-employed as, especially since 2010, their share of persons at-risk-of-poverty has grown and the share of employed persons and pensioners has decreased.
Persons aged 65 or over at-risk-of-poverty were often close to the risk-of-poverty threshold of 60 per cent, or among those whose income was 50 to 59 per cent of the national median income. In turn, young adults at-risk-of-poverty are, on average, farther from the at-risk-of-poverty threshold than other age groups. Around 30 per cent of those aged 18 to 34 below the most commonly used at-risk-of-poverty threshold (60% of median income) were also on the lowest of all, the 40 per cent threshold in 2016.
Number of persons at-risk-of-poverty in different sections of the at-risk-of-poverty distribution by the person’s age in 2016
| Income below 40 % of median |
Income 40 % to 49 % of median |
Income 50 % to 59 % of median |
All persons at-risk-of-poverty |
At-risk-of-poverty rate |
|
| All persons | 102,000 | 124,000 | 357,000 | 623,000 | 11.5 |
| Aged 0 to 17 | 10,000 | 33,000 | 67,000 | 110,000 | 10.2 |
| Aged 18 to 24 | 38,000 | 36,000 | 39,000 | 113,000 | 26.2 |
| Aged 25 to 34 | 20,000 | 25,000 | 38,000 | 83,000 | 12.0 |
| Aged 35 to 49 | 8,000 | 19,000 | 47,000 | 74,000 | 7.5 |
| Aged 50 to 64 | 21,000 | 27,000 | 54,000 | 102,000 | 9.3 |
| Aged 65 to 74 | .. | .. | .. | 46,000 | 7.2 |
| Aged 75 or over | .. | 19,000 | 74,000 | 93,000 | 19.2 |
Persons are classified as being at-risk-of-poverty when the household's disposable monetary income per consumption unit 1) is below 60 per cent of the national median income. In 2016, the at-risk-of-poverty threshold for a one-person household was EUR 14,430 per year or EUR 1,200 per month. Income refers to the monetary income after taxes and consists of earned income, property income, and transfer income.
In the group close to the at-risk-of-poverty threshold, the income is at least EUR 12,020 but under 14,430 per year (EUR 1,000 to 1,200 per month). Persons whose household's disposable monetary income is below EUR 9,620 per year, that is, under EUR 800 per month per consumption unit are classified in the group most at-risk-of-poverty (income under 40 per cent of the median). The middlemost group at-risk-of-poverty, whose income is 40 to 49 per cent of the national median income, is placed between these income groups. The income per consumption unit for those belonging to the group is at least EUR 9,620 but under EUR 12,020 per year (EUR 800 to 1,000 per month).
The number of persons at-risk-of-poverty became revised from the preliminary data released in December 2017. According to preliminary data, there were 637,000 persons at-risk-of-poverty in 2016 but the number has been revised to 623,000 persons. As a result of the preliminary data becoming revised, the number of persons at-risk-of-poverty decreased from 2015 to 2016 by some 0.2 percentage points or around 11,000 persons. The data revision is caused by a methodological change in the weights used to generalise the results to the whole population. As a result of the change, the weights take the population's educational level better into consideration. More information about the effects of the change on the results of the statistics can be found in the quality description of this publication.
1) The consumption units are based on the so-called OECD's modified scale. One adult in the household is one consumption unit. Other persons in the household aged at least 14 each are 0.5 consumption units and children aged 0 to 13 each are 0.3 consumption units. A household with one adult member is one consumption unit, while a household consisting of spouses and one child aged under 14 together are 1.8 consumption units.
Source: Income Distribution Statistics 2016, Statistics Finland
Inquiries: Kaisa-Mari Okkonen 029 551 3408
Director in charge: Jari Tarkoma
- Tables
-
Tables in databases
Pick the data you need into tables, view the data as graphs, or download the data for your use.
- Quality descriptions
Updated 02.03.2018
Official Statistics of Finland (OSF):
Income distribution statistics [e-publication].
ISSN=1799-1331. Poverty 2016. Helsinki: Statistics Finland [referred: 7.2.2026].
Access method: http://stat.fi/til/tjt/2016/01/tjt_2016_01_2018-03-02_tie_001_en.html

