Published: 5 March 2021
Students at risk of poverty have increased somewhat in the 2010s
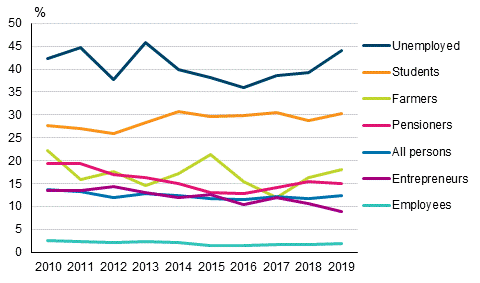
At the beginning of the 2010s, the share of students at risk of poverty was 27.7 per cent and at the end of the decade 30.3 per cent. The at-risk-of-poverty rate of unemployed persons has varied considerably over the decade, but at the end of the decade the rate was almost on level with 2010, over 40 per cent. The at-risk-of-poverty rate of the entire population has fallen since the beginning of the decade. These data derive from Statistics Finland’s income distribution statistics sample.
Risk-of-poverty rate by person’s socioeconomic status 2010–2019, %

When interpreting the development of risk of poverty among students, it should be borne in mind that withdrawals of student loans are not included in income. Student loans absent from the income concept has increased their significance for students' livelihood: According to the Social Insurance Institution's statistics , the number of students having withdrawn student loans has grown by around 60 per cent and the average size of a student loan withdrawn has grown by about 80 per cent from 2010 to 2019.
In other socio-economic groups, changes in the at-risk-of-poverty rate have either been falling or the rates have remained unchanged. Among large population groups, the at-risk-of-poverty rate of pensioners in particular has fallen from 2010 when it was 19.3 per cent to 2019 when it was 15.1 per cent. A total of 215,000 persons belonged to pensioner households at risk of poverty, that is, one-third of persons at risk of poverty were pensioners in 2019. The decrease in the risk of poverty among pensioners is explained by the fact that persons who retired in the 2010s have bigger employment pensions than in the previous generations.
Altogether 669,000 persons, or 12.3 per cent of the household population, were at risk of poverty in 2019. At the beginning of the decade, 13.7 per cent of the population, or 728,000 persons, were at risk of poverty. – More information about the at-risk-of-poverty rates of socio-economic groups in the database table .
Entrepreneur households' income grew most in the 2010s but relative growth was biggest for student households
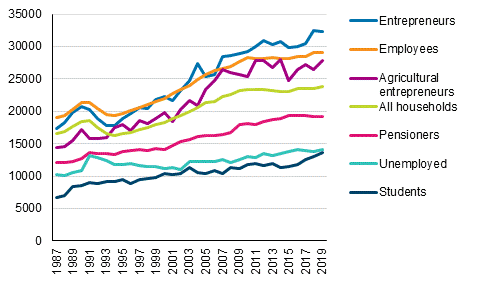
Income of entrepreneur households (not including farmers) has increased the most in the second decade of 21st century (figure). Median income of entrepreneur households grew from EUR 29 200 in 2010 to EUR 32 300 by 2019.
Households’ equivalent disposable money income, median, by socioeconomic status of reference person 1987–2019, EUR in 2019 money

Of the income received by entrepreneur households, wages and salaries have grown most significantly. An increase in earned income may mean an increase in the amount of wages paid by the entrepreneur or in the pay of other persons belonging to entrepreneur households. Despite the growth in total income, the average entrepreneurial income and property income of entrepreneur households have decreased over the same period.
During this period, the relative growth in income was biggest for student households, just over 15 per cent. Despite the relative growth, the income level of student households is, in addition to unemployed persons, the lowest, good EUR 13,600 per consumption unit in 2019. Both in relative and absolute terms, income has grown weakest for employee households, where the median disposable monetary income of households has grown by around EUR 850 or by about three per cent over the decade.
When examining households' income by socio-economic group it should be noted that the household is defined as a student household or an unemployed household only when the household member with the highest income is a student or unemployed person. Good 92 per cent of the students aged under 20 belonged to other than student households, but around one-third of older students belonged to other than student households in 2019. In turn, 60 per cent of unemployed persons belonged to unemployed households and 28 per cent to employed households. Therefore, conclusions on the income development of students or unemployed persons cannot be drawn directly from the households' income examination.
In over 80 per cent of households the person with the highest income is either an employee or a pensioner
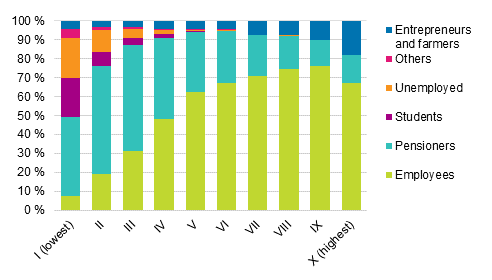
49 per cent of all households were employee households and 34 per cent pensioner households in 2019. These groups are the most common of households in all income deciles (see figure).
Share of households in income decile groups by households’ socioeconomic status 2019, %

In 2019, the share of entrepreneur households (incl. farmers) was highest in the highest income decile (close on 18 per cent) and that of employee households in the second highest income decile (good 76 per cent). All in all, good six per cent of all households were entrepreneur households. Entrepreneur households are divided more evenly than other groups into groups with low, medium and high income.
Slightly under 11 per cent of all households were households where the person with the highest income was either unemployed, a student or other non-employed person (excl. pensioners), such as conscripts or persons looking after their own household. These households made up 46 per cent of the households in the lowest income decile and good 20 per cent of the households in the second lowest income decile.
In the lowest income decile, the share of pensioner households was around 42 per cent and that of employees good seven per cent of all households. The share of pensioner households in households was also highest in the second and third lowest income deciles. The share of employee and entrepreneur households is the bigger the higher the income decile is.
Source: Income Distribution Statistics 2019, Statistics Finland
Inquiries: Kaisa-Mari Okkonen 029 551 3408
Head of Department in charge: Hannele Orjala
- Tables
-
Tables in databases
Pick the data you need into tables, view the data as graphs, or download the data for your use.
Updated 05.03.2021
Official Statistics of Finland (OSF):
Income distribution statistics [e-publication].
ISSN=1799-1331. Income, housing and housing expenditure 2019. Helsinki: Statistics Finland [referred: 19.2.2026].
Access method: http://stat.fi/til/tjt/2019/04/tjt_2019_04_2021-03-05_tie_001_en.html

