Published: 11 March 2021
Shares of households burdened by housing costs are stable
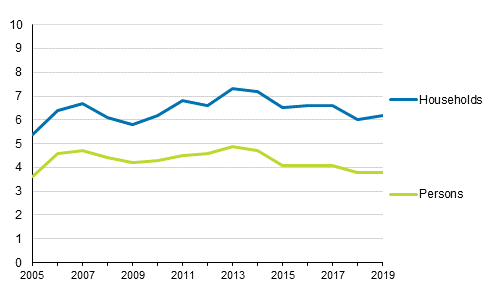
The share of housing costs in income exceeded 40 per cent for 6.2 per cent of households and for 3.8 per cent of persons in 2019. The shares of households and persons were almost the same as in the year before. These data derive from Statistics Finland’s income distribution statistics .
Share of households and persons burdened by housing costs (%) in 2005 to 2019

Households burdened by housing costs: The share of housing costs of disposable monetary income is over 40 per cent. Housing allowances and tax deduction benefit for interests on housing loans are not included in the data.
Of households that had a rented dwelling as the form of tenure, 14.7 per cent were burdened by housing costs in 2019. The share was slightly greater than in the year before (13.9%). However, the share of those burdened by housing costs was relatively lower than in 2014, when the income share of housing costs was over 40 per cent for over seven per cent of all households and for 17.2 per cent of those living in rented dwellings. The share of households burdened by housing costs living in owner-occupied dwellings is small. It was around two to three per cent in 2014 to 2019.
For 20.4 per cent of households at risk of poverty , the income share of housing costs was over 40 per cent in 2019, for as many households as in the year before. The number was at its highest last in 2013 to 2014, when around 23 to 24 per cent of households at risk of poverty were burdened by housing costs.
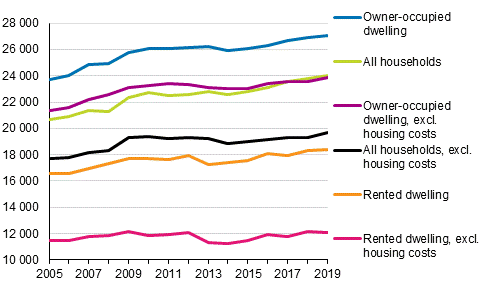
After paying housing costs, income differentials between households living in rented and owner-occupied dwellings were larger than before that. The income levels of households living in rented dwellings were 68 per cent and after housing costs around 50 per cent of the income level of households living in owner-occupied dwellings. The equivalent median income of households living in owner-occupied dwellings was EUR 27,100 and after paid housing costs about EUR 24,000. Income differentials grew from 2010 to 2015 but remained relatively stable after that. The median income of all households in 2019 was around EUR 23,900 and after housing costs paid EUR 19,700.
Households’ median income according to form of tenure of the dwelling in 2005 to 2019, EUR at 2019 prices

Income concepts: Equivalent disposable monetary income (excluding sales gains) per household and equivalent disposable monetary income (excluding sales gains) after paid housing costs per household, median income. Equivalent income = the household’s income divided by the consumption unit figure.
The median income of households at risk of poverty was 54 per cent and after housing costs around 42 per cent of the corresponding equivalent median income of households in 2019.
Source: Income distribution statistics 2019, Statistics Finland
Inquiries: Marie Reijo 029 551 2547
Head of Department in charge: Hannele Orjala
Publication in pdf-format (201.0 kB)
- Tables
-
Tables in databases
Pick the data you need into tables, view the data as graphs, or download the data for your use.
Updated 11.03.2021
Official Statistics of Finland (OSF):
Income distribution statistics [e-publication].
ISSN=1799-1331. Income inequality (international comparison) 2019. Helsinki: Statistics Finland [referred: 19.2.2026].
Access method: http://stat.fi/til/tjt/2019/05/tjt_2019_05_2021-03-11_tie_001_en.html

