Published: 16 December 2021
Corona virus stagnated the income development of household-dwelling units in large towns in Southern Finland
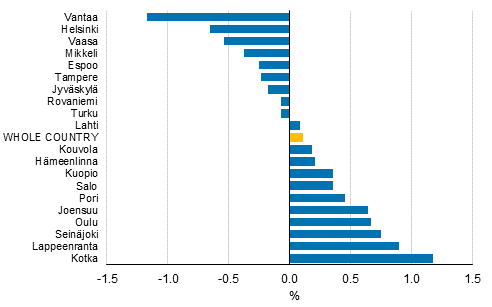
Household-dwelling units' disposable monetary income made a downturn in many places in 2020. Of large towns, income decreased most in Vantaa, where the median income best describing the income of average household-dwelling units was 1.2 per cent lower last year than one year earlier. In Helsinki, the real income of household-dwelling units decreased by 0.7 per cent over the same period according to Statistics Finland’s income distribution statistics. The income development of household-dwelling units was also clearly negative in Espoo, Vaasa, Mikkeli and Jyväskylä last year.
Annual change in household-dwelling units' real income in 2020 (%), 20 municipalities with the largest population

Income concept equivalent disposable monetary income (incl. sales profits) per household-dwelling unit, median. Equivalent income = the household-dwelling unit's income divided by its consumption unit figure. Source: Income distrubution statistics' total data
Of large towns, income grew most in Kotka, where household-dwelling units' real income was good one per cent higher in 2020 than one year previously. Household-dwelling units in Lappeenranta, Seinäjoki, Oulu and Joensuu attained income growth of over half a per cent.
Considering all municipalities, household-dwelling units' income decreased most on Åland in the small municipalities Sottunga (-9.7%) and Vårdö (-5.6%). Correspondingly, real growth in the median income of household-dwelling units was highest in Kustavi (+5.3%) in Southwestern Finland and in Alavieska (+4.8%) in North Ostrobothnia.
Income data for all municipalities for the years 1995 to 2020 are found in the database tables of the income distribution statistics.
Finnish households' real income development close to zero in 2020
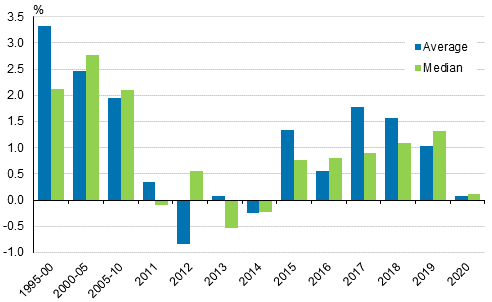
In the early 2010s, the development of household-dwelling units' disposable monetary income was modest for several years, in some years even negative. Around the middle of the decade, income development turned clearly positive, and income development continued moderate for five years in the second half of the 2010s.
The first coronavirus year is clearly visible in household-dwelling units' income, because the development of disposable monetary income measured with both average and median income stagnated at close to zero in 2020. The income development of household-dwelling units has last been this weak in the early 2010s.
Annual changes in household dwelling-units’ real income in 1995 to 2020

Change in 1995 to 2000, 2000 to 2005 and 2005 to 2010 describes the average annual change in the period. Income concept: equivalent disposable monetary income (excl. sales profits) per household-dwelling unit. Equivalent income = the household-dwelling unit's income divided by its consumption unit figure. Source: Income distrubution statistics' total data
The weak development in disposable monetary income is caused by a decrease in the amount of factor income, or market income. Measured by average, household-dwelling units' wages and salaries, which are by far the most significant income item, dropped by nearly two per cent in 2020 compared to the previous year. Entrepreneurial income decreased clearly more, in real terms by around nine per cent.
Household-dwelling units' disposable monetary income consists of wages and salaries, and entrepreneurial and property income received by the members of the household-dwelling units during the year, as well as received social security benefits and pensions (including earnings-related pensions), from which compulsory taxes and tax-like payments paid on the income have been deducted. All tax-free income (such as child benefits, housing and subsistence allowances, and tax-free dividends) are also taken into account in income.
Source: Income distribution statistics 2020, Statistics Finland
Inquiries: Pekka Ruotsalainen 029 551 2610
Head of Department in charge: Hannele Orjala
- Tables
-
Tables in databases
Pick the data you need into tables, view the data as graphs, or download the data for your use.
Updated 16.12.21
Official Statistics of Finland (OSF):
Income distribution statistics [e-publication].
ISSN=1799-1331. Poverty 2020. Helsinki: Statistics Finland [referred: 19.2.2026].
Access method: http://stat.fi/til/tjt/2020/02/tjt_2020_02_2021-12-16_tie_002_en.html

