

Published: 14 June 2017
Turnover in manufacturing increased by 12.2 per cent in January to March
According to Statistics Finland, turnover in manufacturing in the January to March period was 12.2 per cent higher than in the corresponding period of the year before. Domestic sales grew by 10.0 per cent and export turnover by 13.8 per cent from one year ago.
Three months' year-on-year change in turnover in manufacturing (C) sub-industries (TOL 2008)
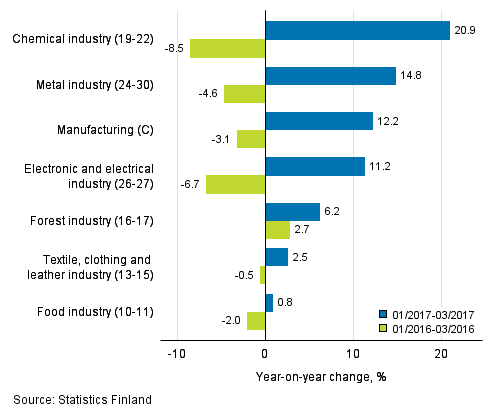
Turnover went up from the corresponding period of the previous year in all manufacturing (C) sub-industries . Turnover increased most in the chemical industry, by 20.9 per cent, and in the metal industry, by 14.8 per cent. Growth was slowest in the food industry, 0.8 per cent and in the textile, clothing and leather industry, 2.5 per cent.
Three months' year-on-year change in turnover in main industrial categories (TOL 2008)
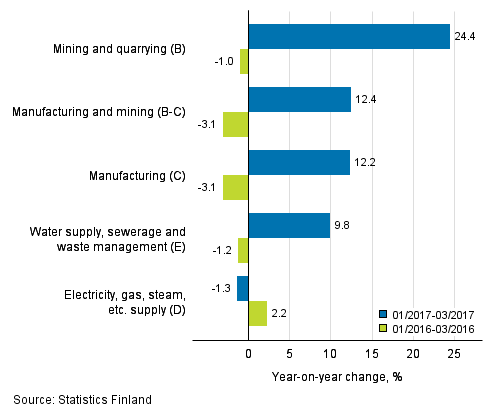
The turnover of nearly all main categories of manufacturing industries grew year-on-year. Turnover grew strongest in the industry of mining and quarrying, 24.4 per cent. Turnover contracted from the previous year by 1.3 per cent in electricity, gas, steam and air conditioning supply.
The index of turnover in industry describes enterprises whose main industry is manufacturing. The calculation of the indices is based on the Tax Administration’s self-assessed tax data which are supplemented with data obtained with Statistics Finland’s sales inquiry. The monthly turnovers of manufacturing enterprises can vary considerably, especially in the metal industries. The variation is mainly due to invoicing practices. The final invoice for major machinery deliveries and projects may be recorded in the sales of one month, even if the delivery had required the work of several months or years.
Changes in the Tax Administration’s self-assessed tax data have not so far had an effect on the data of turnover indices
The effects of the changes in the Tax Administration's self-assessed tax data have been analysed in Statistics Finland’s turnover indices. Based on the analyses, the changes have thus far not been found to have significant effects on enterprises’ VAT reporting in terms of statistics production. More information about this in Changes in the periodic tax return data used in turnover indices.
Source: Index of turnover in industry 2017, March, Statistics Finland
Inquiries: Maija Sappinen 029 551 3348, Kirsi-Maaria Manninen 029 551 2681, myynti.teollisuus@stat.fi
Director in charge: Sami Saarikivi
Publication in pdf-format (347.4 kB)
- Tables
-
Tables in databases
Pick the data you need into tables, view the data as graphs, or download the data for your use.
Appendix tables
- Figures
-
- Appendix figure 1. Trend series on total turnover, domestic turnover and export turnover in manufacturing (14.6.2017)
- Appendix figure 2. Trend series on total turnover, domestic turnover and export turnover in the forest industry (14.6.2017)
- Appendix figure 3. Trend series on total turnover, domestic turnover and export turnover in the chemical industry (14.6.2017)
- Appendix figure 4. Trend series on total turnover, domestic turnover and export turnover in the electronic and electrical industry (14.6.2017)
- Revisions in these statistics
-
- Revisions in these statistics (14.6.2017)
Updated 14.6.2017
Official Statistics of Finland (OSF):
Index of turnover in industry [e-publication].
ISSN=1798-596X. March 2017. Helsinki: Statistics Finland [referred: 26.7.2026].
Access method: http://stat.fi/til/tlv/2017/03/tlv_2017_03_2017-06-14_tie_001_en.html