Published: 23 April 2010
Development of productivity in the national economy 1976-2009*
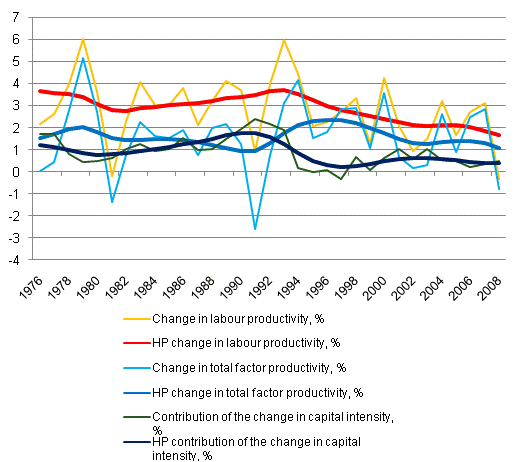
Based on preliminary national accounts data, the growth rate of labour productivity in the whole national economy was -2.8 per cent in 2009, having been -0.4 per cent in 2008, 3.1 per cent in 2007 and 2.7 per cent in 2006. The respective growth rate of total factor productivity was -0.8 per cent, having been 2.8 per cent in 2007 and 2.5 per cent in 2006. The contribution of capital intensity growth in the whole national economy was 0.5 per cent in 2008, 0.3 per cent in 2007 and 0.2 per cent in 2006.
Figure 1. Development of productivity in the whole national economy 1976-2009*, %

The HP filtered long-term growth trend indicates that the pace of growth in labour productivity has slowed down strongly in the whole economy since the mid-1990s, from 3.5 per cent to 1.7 per cent in 2008. Although the annual growth rates for individual years (2004, 2006 and 2007) have been around 3 per cent the trend in labour productivity has been declining continuously since the mid-1990s. Over the 1975-1995 time period, labour productivity grew at the pace of around 3 per cent per annum in the whole economy. The respective long-term growth trend for total factor productivity shows that total factor productivity fluctuated between 1 and 2 per cent before the year 1993. Between 1993 and 2000, total factor productivity grew at the average rate of 2 to 2.5 per cent per annum. Since 2000, the growth trend of total factor productivity has been around 1.3 to 1.5 per cent per annum. The growth trend of total factor productivity was at its lowest in the 2000s in 2008 when it was 1.1 per cent. Before 1993, the change in the growth trend of capital intensity was around 1 to 1.5 per cent, but it slowed down clearly in the 1993 to 2000 period. Since 2000, the annual growth rate of capital intensity has remained at approximately 0.5 per cent.
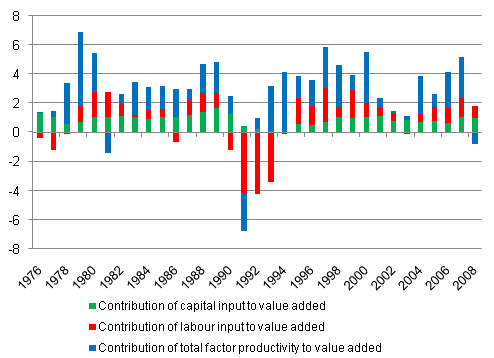
The most important factor in the growth of value added of the whole national economy has been the growth of total factor productivity. According to preliminary national accounts data, the contribution of total factor productivity to the growth of value added was, however, negative at -0.8 percentage points in 2008, having been 2.8 percentage points in 2007 and 2.5 percentage points in 2006. The contribution of capital input has been steady and in 2008 it amounted to 0.1 percentage point, having been 1.1 percentage points in 2007 and 0.7 percentage points in 2006. The contribution of labour input to the growth of value added was 0.9 percentage points in 2008, having been 1.3 percentage points in 2007 and 1.0 percentage point in 2006.
Figure 2. Contributions to value added, percentage points

The effect of the structural change in labour input as well as types of capital goods on economic growth has been estimated at the level of the whole national economy. The contribution of the structural change in labour input to the growth of value added was strongest during the past recession of 1990-1994, when it was 0.8 per cent per annum. During the period prior to this the structural change in labour input contributed annually approximately 0.5 per cent to the growth of the volume of value added. The impact of the structural change in labour input to the growth of value added has weakened since the mid-1990s. Between 1995 and 2004 the impact was about 0.2 per cent per annum and in recent years around 0.1 per cent per annum.
The contribution of ICT capital to the growth of value added increased strongly during the IT boom in 1995-1999 and stood at 0.5 per cent per annum. During the 2000s the contribution of ICT capital has averaged 0.3 per cent per annum. On the basis of the results of the pilot survey for a satellite account on R&D activity the contribution of R&D investments to total factor productivity has averaged at 0.24 per annum in 2000 to 2004 and at 0.20 per cent per annum in 2005 to 2008.
| 1976-1989 | 1990-1994 | 1995-1999 | 2000-2004 | 2005-2008 | |
| Gross Domestic Product | 3,3 | -0,9 | 3,5 | 2,9 | 3,2 |
| Change in Labour input | 0,7 | -3,4 | 2,3 | 0,8 | 1,6 |
| ...Hours worked | 0,1 | -4,5 | 2,0 | 0,5 | 1,4 |
| …Labour composition | 0,6 | 1,1 | 0,3 | 0,3 | 0,2 |
| Labour productivity | 3,2 | 3,6 | 1,5 | 2,4 | 1,8 |
| Change in Capital input | 3,7 | 1,5 | 2,2 | 2,4 | 2,4 |
| Contribution of labour input | 0,5 | -2,6 | 1,1 | 0,5 | 1,0 |
| ...Hours worked | 0,1 | -3,4 | 0,9 | 0,3 | 0,9 |
| …Labour composition | 0,5 | 0,8 | 0,2 | 0,2 | 0,1 |
| Contribution of capital input | 1,1 | 0,4 | 0,9 | 0,9 | 0,9 |
| …ICT capital | 0,12 | 0,25 | 0,48 | 0,31 | 0,28 |
| - Computers | 0,02 | 0,13 | 0,27 | 0,03 | 0,04 |
| - Communication equipment | 0,01 | 0,02 | 0,08 | 0,06 | 0,11 |
| - Software | 0,09 | 0,10 | 0,13 | 0,22 | 0,13 |
| …Other Machinery and Equipment | 0,41 | -0,08 | -0,01 | 0,14 | 0,06 |
| …Other capital | 0,58 | 0,26 | 0,39 | 0,46 | 0,53 |
| Total factor productivity | 1,6 | 1,3 | 1,6 | 1,4 | 1,3 |
| , of which R&D capital contribution 1) | 0,24 | 0,20 |
Besides figures on productivity, the release also contains a methodological description of the KLEMS productivity calculations used in the Productivity Review, and summaries about the satellite account on R&D activity, and the revision of national accounts time series, as well as data on the productivity of the public sector.
Source: Tuottavuuskatsaus 2010. Statistics Finland
Inquiries: Antti Pasanen (09) 1734 2629, skt.95@stat.fi
Director in charge: Ari Tyrkkö
- Tables
-
Tables in databases
Pick the data you need into tables, view the data as graphs, or download the data for your use.
Updated 23.4.2010
Statistics:
Productivity surveys [e-publication].
ISSN=2343-4333. 2009. Helsinki: Statistics Finland [referred: 23.2.2026].
Access method: http://stat.fi/til/ttut/2009/ttut_2009_2010-04-23_tie_001_en.html

