

Published: 8 October 2021
Industrial output grew in August both from the previous month and from one year back
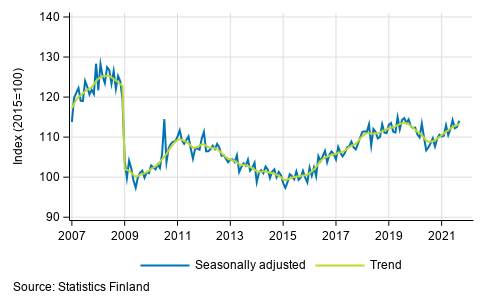
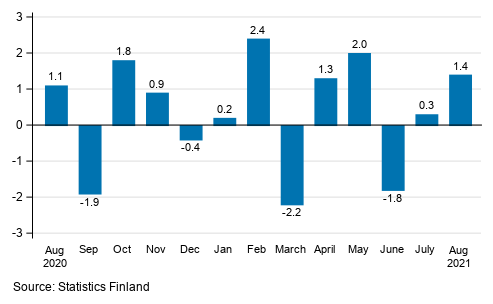
Seasonally adjusted industrial output (TOL BCD) grew by 1.4 per cent in August from the month before. According to Statistics Finland, industrial output adjusted for working days was 4.4 per cent higher in August 2021 than in August 2020.
Trend and seasonally adjusted series of industrial output (BCD), 2007/01 to 2021/08
Seasonally adjusted change in industrial output (BCD) from previous month, %, TOL 2008
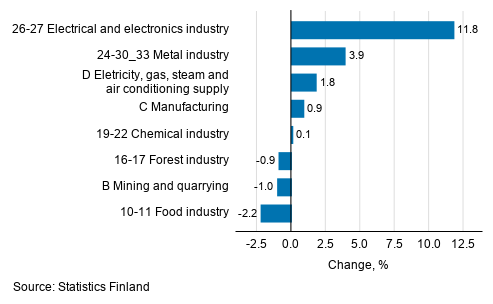
Examined by main industry, seasonally adjusted industrial output grew in August most in the electrical and electronics industry, by 11.8 per cent from the previous month. Output in the metal industry grew by 3.9 per cent and in the industry of electricity, gas, steam and air conditioning supply by 1.8 per cent compared with July. Output fell in the forest industry by 0.9 per cent from the previous month and in the food industry by 2.2 per cent.
Compared to one year ago, output increased again most in the forest industry, by 9.9 per cent. Output was higher than in the previous year in the metal industry, 7.9 per cent, in the electrical and electronics industry, 7.5 per cent, and in electricity, gas, steam and air conditioning supply, 6.4 per cent. In contrast, output declined in the chemical industry by 2.3 per cent compared with the previous year.
Seasonal adjusted change in industrial output by industry, 07/2021 to 08/2021, %, TOL 2008
Revised data for August 2021 will be published at 8 am on 10 November 2021 in connection with the release of industrial output data for September 2021. The revision is influenced by the estimation used in the latest release, which is based on the Tax Administration's data on self-assessed taxes used for enterprises with fewer than 50 employees. Because of the method used, seasonally adjusted figures for previous months may change even if the original figures do not become revised. The seasonally adjusted figures are also adjusted for working days.
Source: Volume Index of Industrial Output 2021, August. Statistics Finland
Inquiries: Maarit Mäkelä 029 551 3324, Kirsi-Maaria Manninen 029 551 2681, volyymi.indeksi@stat.fi
Head of Department in charge: Katri Kaaja
Publication in pdf-format (333.3 kB)
- Reviews
- Tables
-
Tables in databases
Pick the data you need into tables, view the data as graphs, or download the data for your use.
- Figures
- Revisions in these statistics
-
- Revisions in these statistics (8.10.2021)
Updated 8.10.2021
Official Statistics of Finland (OSF):
Volume index of industrial output [e-publication].
ISSN=1798-9272. August 2021. Helsinki: Statistics Finland [referred: 27.7.2026].
Access method: http://stat.fi/til/ttvi/2021/08/ttvi_2021_08_2021-10-08_tie_001_en.html