This set of statistics has been discontinued.
New data are no longer produced from the statistics.
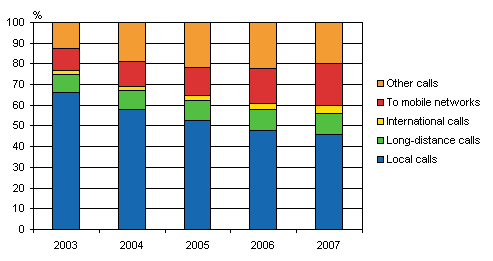
Figure 3. The distribution of call minutes from local telephone networks in 2003-2007, per cent

Source: Telecommunications 2007, Statistics Finland
Inquiries: Mervi Niemi (09) 1734 3263, Kari-Pekka Niemi (09) 1734 3399, tiede.teknologia@stat.fi
Director in charge: Kaija Hovi
Updated 5.6.2008
Official Statistics of Finland (OSF):
Telecommunications [e-publication].
2007,
Figure 3. The distribution of call minutes from local telephone networks in 2003-2007, per cent
. Helsinki: Statistics Finland [referred: 9.2.2026].
Access method: http://stat.fi/til/tvie/2007/tvie_2007_2008-06-05_kuv_003_en.html

